Pilots should note that in all cases where a difference may be noted:
- the ENC depiction will more closely resemble real-world features due to scale limitations inherent in paper charts
- ENC are used as the source for updating paper charts – updates to paper charts will therefore either be released in parallel with the ENC, or lag behind, but will never precede an ENC update.
Background
AMSA was alerted by a coastal pilot about a particular example in the Great North East Channel (GNEC) pilotage area, where the information shown on a paper chart differed visually from the information depicted on the ENC, for the same area.
In particular, the depiction of the 15m depth contour was quite different when referenced against the boundary of the two-way route (TWR) at this location, depending on the type of chart being viewed.
AMSA subsequently contacted the Australian Hydrographic Office (AHO) to seek clarification regarding this, and other potential similar circumstances.
Example
The following images provide an example of the how information may differ between an ENC and a paper chart, for the same location.
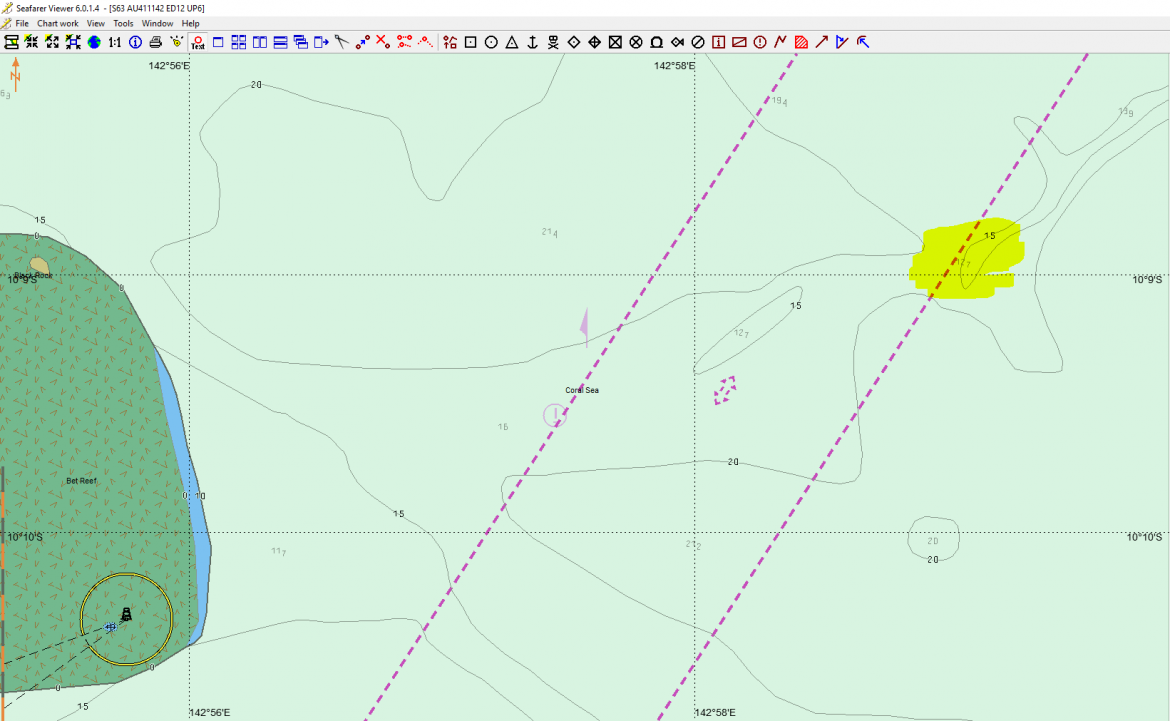
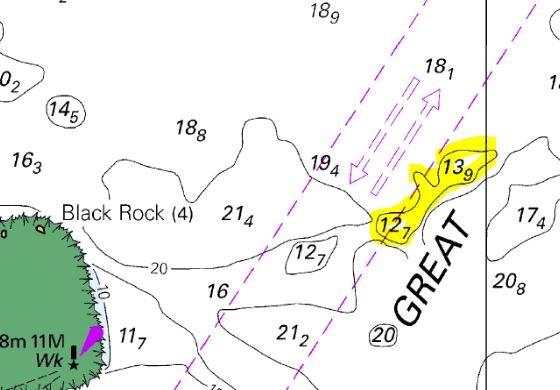
The image below shows the same location on ENC AU411142 (at the same time), at a nominal level of zoom. Note the location of the 15m depth contour (highlighted in yellow) completely east of the (eastern) TWR boundary at this location.
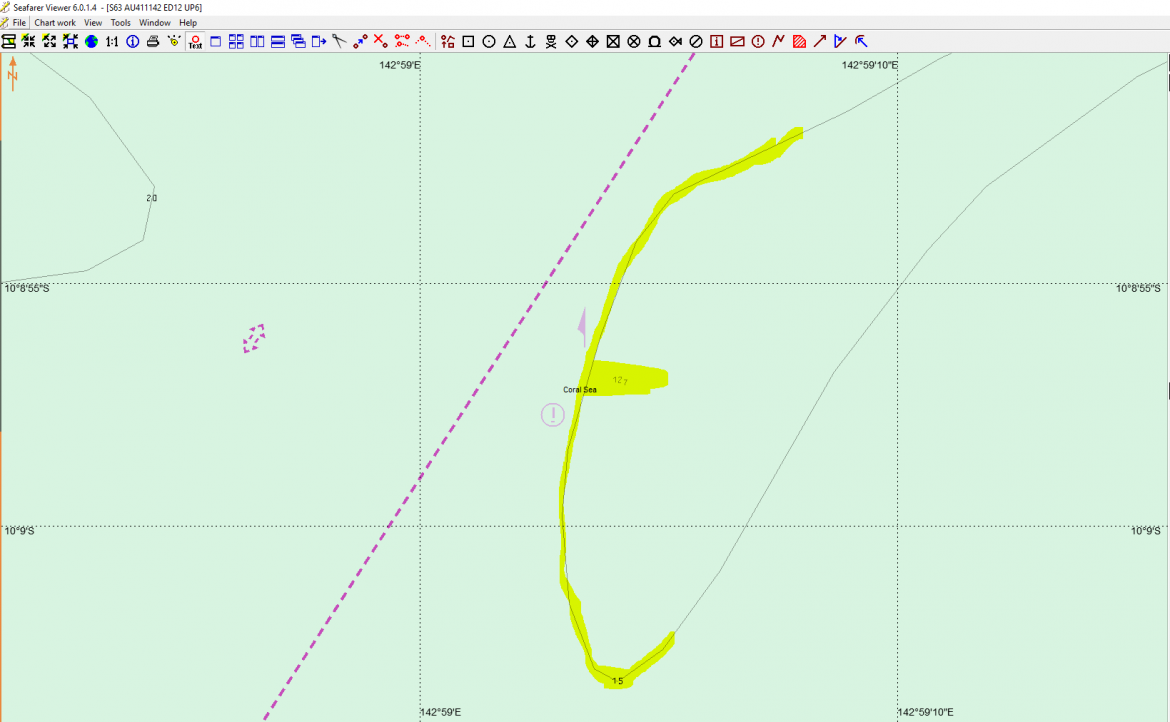
The following image shows the same location on the ENC, at a greater level of zoom. The 15m depth contour is clearly depicted well east of the TWR boundary, in contrast to the paper chart for the same location.
It should be noted that a subsequent block update to the paper chart was issued by the AHO (Edition 11 – NTM 536/2019), resulting in a similar depiction of the contours at this location, however the above example highlights how information may differ between ENC and paper chart from time to time (for the reasons outlined in the ‘Reasoning’ section below).
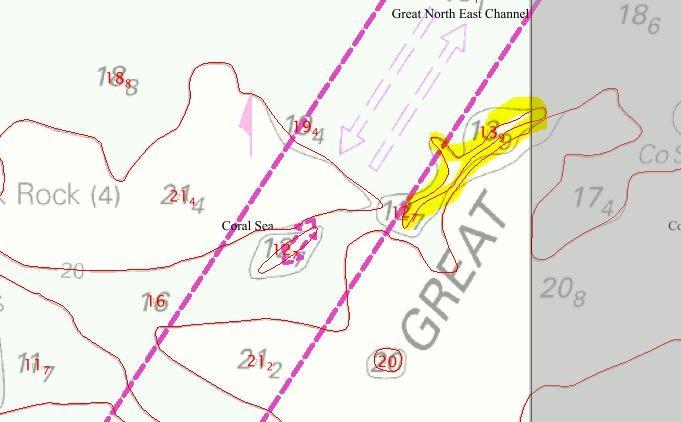
The following image shows the same area of the ENC overlayed on top of the paper chart AUS 839 (post block correction), with updated contours in red:
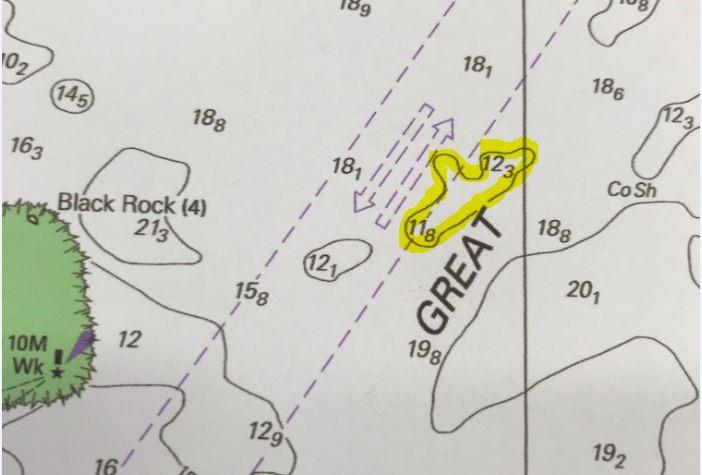
The current paper chart for this location looks like this:
Reasoning
The AHO advised that there are a number of different reasons why the information may differ between an ENC and a paper chart for the same location, from time to time.
The reasons fall predominantly into two main categories (timing differences or detail differences).
Timing differences:
- ENC updates and smaller Notice to Mariners (NtM) corrections for paper charts are published in parallel. These include all Notices where a ‘block correction’ for the paper chart is not required (i.e. where the mariner must ‘draw / write’ them on the chart). However, a delay in applying the correction (either physically or electronically) could result in a difference in charted information.
- A time delay between publication of the ENC and subsequent derivation of the paper chart ‘block correction’ content from the updated ENC. For an update published as a ‘block correction’ via NtM, this is likely to be two weeks, which could account for different charted details.
- A time delay between publication of the ENC and subsequent derivation of the paper chart ‘new edition’ content. For a new edition of a paper chart, the time difference may be greater due to the longer time required for Quality Assurance (QA) checks. QA checks for an ENC can be substantially automated, whereas scope for automating checks for a paper chart are limited.
Detail differences:
- ENCs are compiled at larger scale than the paper chart, so not all detail can fit on the paper chart. This is referred to as ‘generalisation’. Importantly, shoal depth contours on a paper chart are enlarged to ensure the depth value remains legible and that the contour does not pass ‘through’ the depth value (which is why a difference still exists between figures 4 and 5 above. This is a very typical issue across chart products and is governed completely by scale of the product.
- Generalisation results in smoothing of contours, and may group together several adjacent shoals or other closely placed related features where the paper chart scale is too small to show them separately, or where this would result in a visually confusing image. Paper charts are therefore less likely to show deeper depths between shoals in complex areas.
- Small shifts in the position of AtoN are applied to ENC, but may not be applied to paper charts if the shift is smaller than the size of the symbol’s base on the paper chart (about 1mm on paper).
- If new depth information added to an ENC in an ‘open’ area shows a change in depth less than the Zone of Confidence (ZOC) vertical accuracy, the depths on the paper chart may not be updated. However, any ‘controlling depth’ for a route leg, or any change greater than the ZOC vertical accuracy for that area, will be updated on the paper chart to match the ENC. Paper charts may therefore show a shallower depth than the ENC in open areas.
Noteworthy information
Paper charts are derived from ENCs, in all cases. Due to scale limitations and production dependencies, some differences may be noted.
If there is a difference between an ENC and a paper nautical chart for a given location, the ENC is the authoritative reference.
The AHO also advises the following points of interest:
- Paper charts now represent 16% of total user-demand, yet absorb 60% of cartographic effort.
- To address the imbalance between demand and resources, the AHO will be withdrawing 130 coastal and port paper nautical charts without replacement by August 2020. Where nominated paper charts are withdrawn, there will be a greater level of detail difference apparent between the ENC and the remaining smaller scale paper chart.
- Affected paper charts will be listed in Notices to Mariners from 7 Feb 2020 onward.
- Coastal paper chart coverage will be reduced to 1:150,000 or 1:300,000 (but not both).
- Scales larger than 1:150,000 of coastal areas will also be withdrawn, except those covering central Torres Strait.
- Ports and places of refuge will be reduced to coverage at a single scale of paper chart only, sufficient to allow a ship to navigate to an anchorage or pilot boarding ground in the event of ECDIS failure.
Please forward any queries about this PAN to coastal.pilotage@amsa.gov.au