Serious injuries (2020-2022)
Figure 10 shows the number of serious injuries to seafarers reported to AMSA between 2020 and 2022.
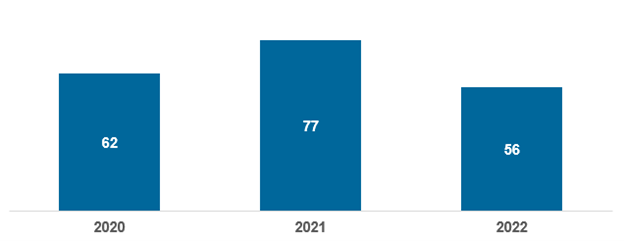 Figure 11 – Number of serious injuries7 reported to AMSA 2020-2022
Table 7 shows the number of serious injuries reported by Australian-flagged vessels and foreign-flagged vessels. It should be noted that Australian-flagged vessels report to AMSA regardless of their geographical location. Foreign-flagged vessels are only required to report injuries that occur in Australian waters.
| Vessel flag | 2020 | 2021 | 2022 |
|---|---|---|---|
| Australian flagged | 22 | 18 | 14 |
| Foreign flagged | 40 | 59 | 42 |
Fatalities (2018-2022)
AMSA categorises all deaths at sea according to the taxonomy8 below:
- Operational
- Illness/disease
- Person overboard (presumed deceased)
- Suicide
- Other
The total number of seafarer fatalities reported to AMSA from 2018 to 2022 includes fatalities which occurred within the Australian Exclusive Economic Zone (EEZ)9 and fatalities which occurred outside of the Australian EEZ but were still reported to AMSA.
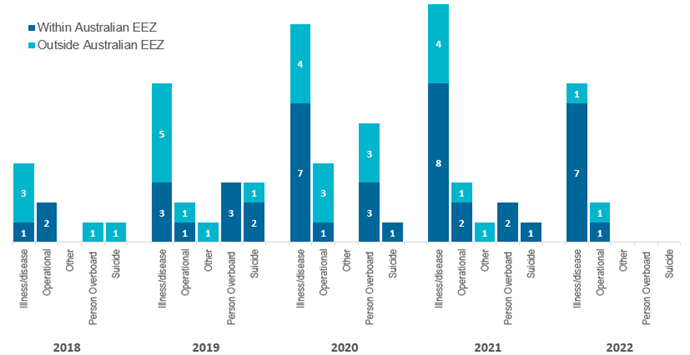 Figure 12 – Total reported seafarer fatalities by jurisdiction, type of fatality and year, 2018-2022
Fatality rate
In 2022, the fatality rate (the number of fatalities per 100,000 seafarers10) for foreign flagged vessels in Australia’s Exclusive Economic Zone was 2.2. This is lower than the five-year average fatality rate of 2.7 per 100,000 seafarers as per Table 8. This fatality rate is slightly higher than the Australian national fatality five-year average rate of 1.4.
Also noted by SafeWork Australia (Safe Work Australia Work-related, traumatic injury fatalities Australia 2021 Report) fatality rates are sensitive to the number of people employed in the industry and this may be particularly evident with small variation in the number of fatalities for smaller industries that employ fewer employees11. Therefore, the actual number of fatalities needs to be considered when interpreting the fatality rates for this data.
| Year of incident | Number of operational-related seafarer fatalities | Fatality rates per 100,000 seafarers10 |
|---|---|---|
| 2018 | 2 | 2.2 |
| 2019 | 2 | 2.2 |
| 2020 | 4 | 4.4 |
| 2021 | 2 | 2.2 |
| 2022 | 2 | 2.2 |
| Five-year average (2018-2022) | 2.4 | 2.7 |
Fatalities by illness/disease
There has been a decrease in fatalities by illness/disease reported in 2022 when compared to 2020 and 2021 data. The higher numbers reported for 2020 and 2021 may have been exacerbated by the ongoing COVID-19 pandemic.
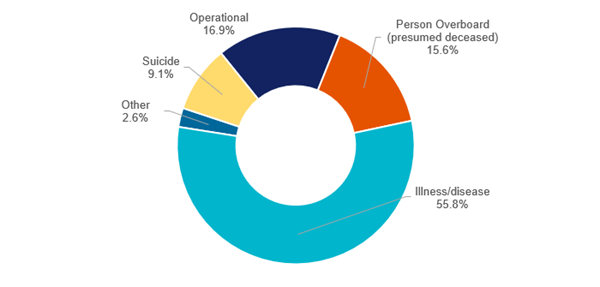 Figure 13 – Proportion of reported deaths by fatality type 2018-2022 (combined)
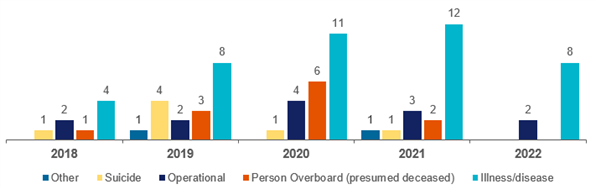 Figure 14 – Total reported seafarer deaths by fatality type, 2018-2022
Illness/disease make up the majority of reported fatalities. However, it is difficult to ascertain whether this is consistent with global trends due to the lack of data being collated and made available by flag States. In 2022, AMSA submitted a proposal to mandate the requirement to report all fatalities at sea to the International Labour Organization at the 4th meeting of the MLC Special Tripartite Committee (STC). The STC agreed to the proposal for deaths of seafarers on board vessels to be reported annually to the International Labour Organization (ILO) and for the relevant data to be published in a global register. These amendments will enter into force in 2024.
Footnotes
7 AMSA classifies serious injuries to include injuries that require emergency treatment, in most cases leading to an emergency medivac from the vessel and/or hospitalisation.
8 Refer to the glossary of this report.
9 The Exclusive Economic Zone (EEZ) is an area beyond and adjacent to the territorial sea. The outer limit of the exclusive economic zone cannot exceed 200M from the baseline from which the breadth of the territorial sea is measured. The Australian EEZ is defined in the Seas and Submerged Lands Act 1973 ('the SSL Act').
10 Based on a calculated approximation of 90,000 seafarers engaged on foreign flagged vessels in Australian waters in 2022.
11 Safe Work Australia, Work-related, traumatic injury fatalities Australia 2021