Open a newspaper or turn on the local news and chances are you’ll find a story about a vessel incident.
Severe weather events…Capsized vessels…Injured, lost or stranded crew...Near misses, collisions and technical failures all make the headlines while many other incidents go unnoticed or unreported.
Incidents can result in loss of life, loss of income and loss of reputation. So when an incident occurs we all need to report, consider, learn and respond by taking the right actions to improve safety outcomes.
Summary of findings
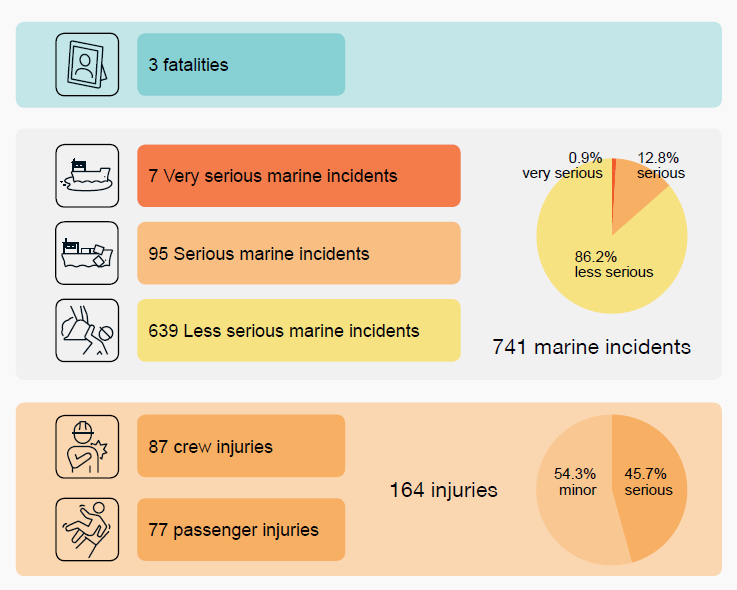
741 reported marine incidents
- Vessel control and navigation (80.7%) represented the most frequently reported operational event, followed by those associated with access to the vessel (4.9%).
- The most common vessel consequences were contact (34.9%) followed by collision (21.4%), grounding (13.9%), close quarters (10.5%) and flooding (7.7%).
- Power propulsion and steering (45.6%) represented the most frequently reported technical failure.
- Under power propulsion and steering, main engine and steering gear were the most frequently reported equipment failures.
Introduction
We are pleased to present the first Domestic Commercial Vessel marine incident annual report. Marine incident reporting is an important source of information that informs regulation and approaches to managing safety.
Since 2018, AMSA has been working to improve the collection and use of marine incident data so that it can be used to better inform education and compliance activities. The report focuses on 2019 marine incident data, the first full calendar year of incident reporting to AMSA.
Marine incident reporting
The owner or master of a domestic commercial vessel (DCV) has an obligation to report marine incidents to AMSA1. While this requirement is mandatory, it is also important from a safety perspective, as reporting informs the ongoing safety of operations, people and vessels.
In most cases, this involves two-steps:
- Incident Alerts: the owner or master must alert AMSA as soon as practicable and within four hours of a marine incident. The incident alert informs AMSA that an incident has occurred. An incident alert may not include all the information required to close the incident.
- Incident Reports: the owner or master must report an incident to AMSA within 72 hours of it occurring. The incident report is a more detailed, follow-up report.
Information provided in the reports assures AMSA, as the regulator, that the owner, operator and master understand the safety issues that contributed to the incident, and have implemented measures to learn from the incident and to prevent recurrence.
Reporting marine safety concerns
AMSA also accepts and responds to reports relating to marine safety concerns. Anyone, can report a safety concern, such as observing incidents that may endanger, or if not corrected could endanger, the safety of vessel or persons.
In 2019, AMSA received a total of 133 marine safety concern reports.
The value of incident and safety concern reporting is the development of more effective safety strategies and advice for regulators, owners, operators and seafarers to avoid similar incidents in the future. Incident reporting and the subsequent analysis should also be part of the vessel’s safety management system.
Profile of vessel fleet
Classification of vessels
Domestic commercial vessels (DCV) operate within Australia’s Exclusive Economic Zone (EEZ) for commercial, research or government purposes and are classed into one of four categories, depending on the vessel’s use.
| Vessel use | Vessel class |
|---|---|
| Passenger vessels (13 or more passengers) | Class 1 |
| Non-passenger vessels (up to 12 passengers) | Class 2 |
| Fishing vessels | Class 3 |
| Hire and drive vessel used by the hirer only for recreational purposes | Class 4 |
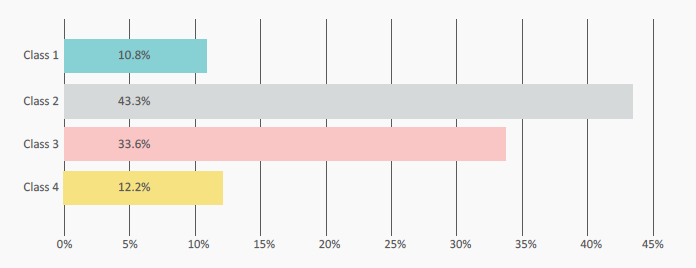
There are approximately 22,000 active DCVs2 operating across four classifications. Class 2 vessels (43.3%) represents the largest group of vessels.
Locations of vessel fleet
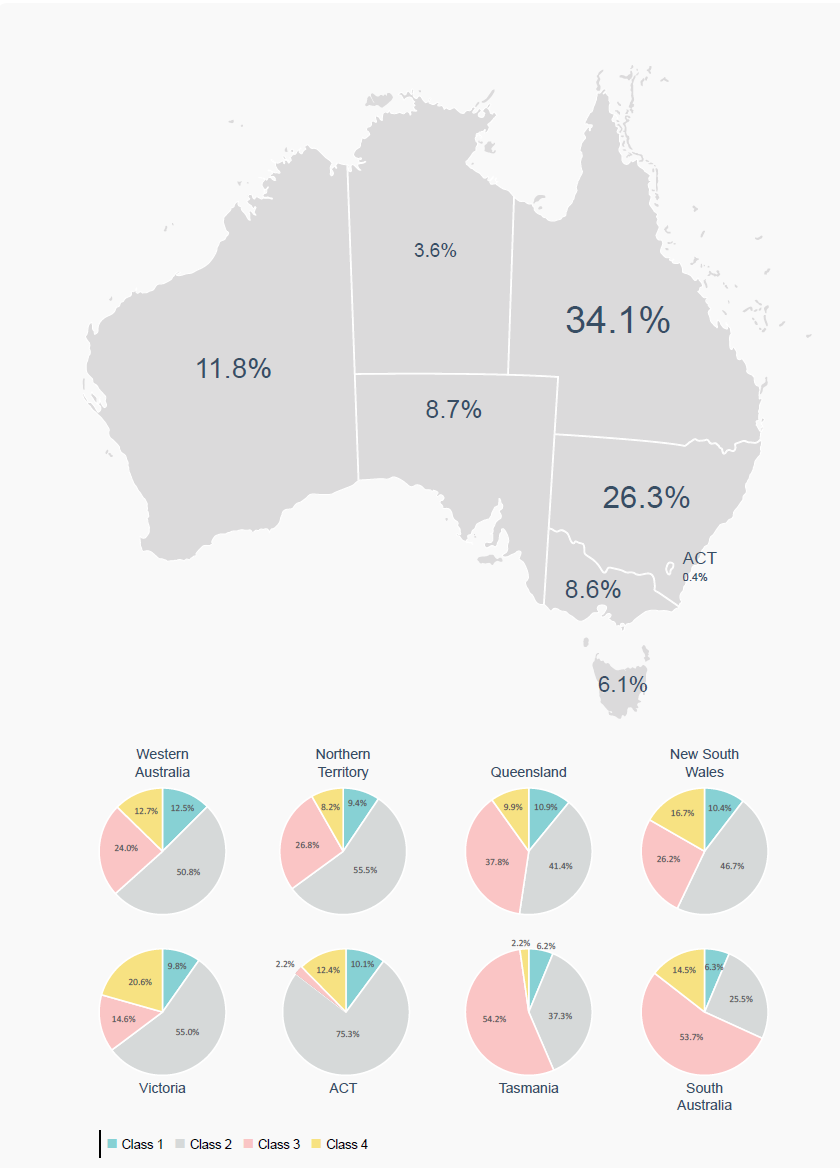
The largest proportion of the fleet operates in Queensland (34.1%), followed by New South Wales (26.3%) and Western Australia (11.8%).
The largest proportion of vessels in each state/territory are Class 2 vessels, with the exception of Tasmania and South Australia, where the largest proportion of vessels are Class 3.
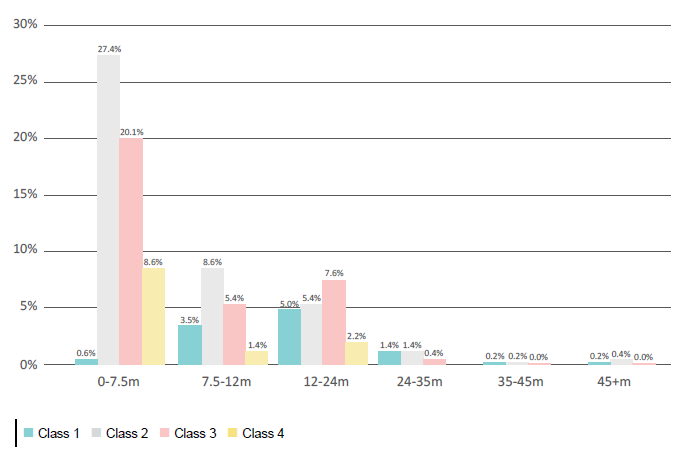
Length of vessels by classification
The vessel distribution by class and length (Figure 3), shows that more than half of the active DCV fleet is under 7.5m in length (56.7%).
Marine incident reporting
In 2019, 741 marine incidents involving DCVs were reported to AMSA.
Each month, AMSA publishes a summary of the DCV incidents that have been reported. This includes the total number of incident reports received and brief descriptions of the very serious and serious incidents3.
These are published on our website.
Reported incidents by month
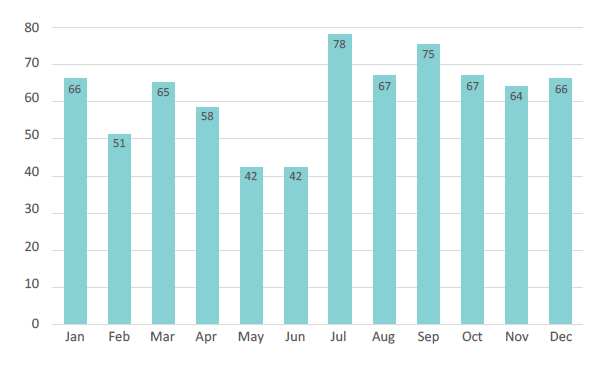
With an average of 62 marine incident reports per month in 2019, the number of reported incidents varies from month to month, ranging from a total of 42 reported in May and June to 78 in July. The graph below may indicate that there are seasonal trends associated with vessel activity, however, it is difficult to draw any conclusions when only assessing a single year of data.
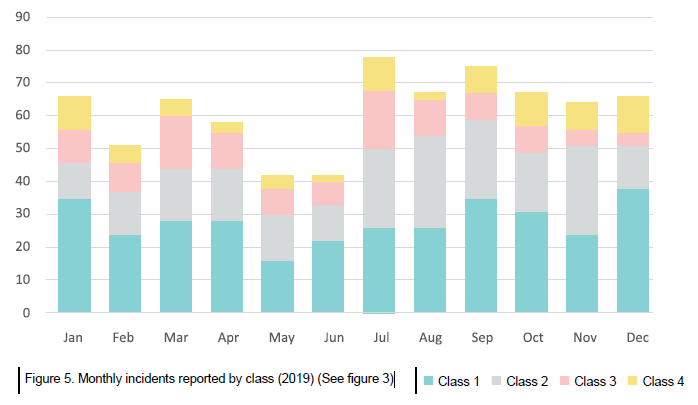
Incident reporting trends by classification
Figure 5 shows the monthly number of marine incidents reported to AMSA in 2019 categorised by vessel class.
Insight
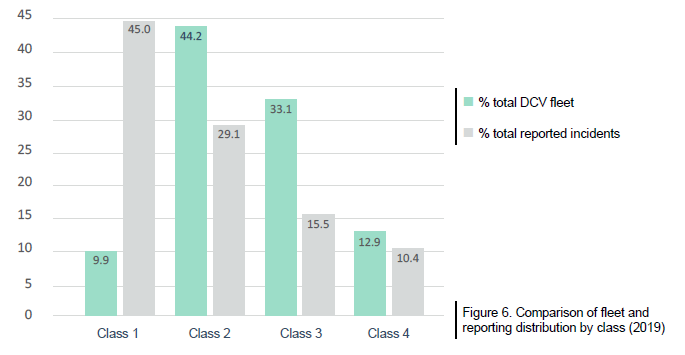
Comparison with various data sources suggest that under-reporting of marine incidents is evident in the DCV sector. Generally, however, the data suggests that the operators of Class 1 vessels have a better reporting culture than those of all other classes of vessels.
The data also shows that Class 3 vessel operators have the poorest reporting culture. This is evident when comparing the proportion of the fleet to the proportion of incidents reported by vessel class (Figure 6). Class 1 vessels account for 45% of incident reports in 2019, while only representing 9.9% of the DCV fleet. In contrast, Class 3 vessels account for only 15.5% of the incident reported, while representing 33.1% of the DCV fleet.
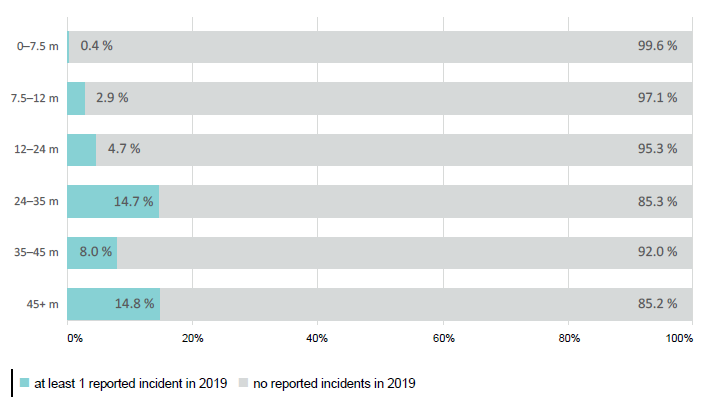
The data also suggests that the operators of larger vessels (>24m) report proportionally more incidents than those of vessels <24m in length (Figure 7).
Reporting by vessel length
Insight
This data identifies the need for improvements in marine incident reporting rates across the fleet. The importance of marine incident reporting is that it allows for both reactive (accident investigations) and proactive (trend analyses) measures to be used to prevent similar reoccurrences. Not reporting incidents means that valuable insights may be missed and safety may be affected.
This is evident in the DCV fleet when compared to other sources of data such as the international commercial vessel fleet. Research in this area has identified the following as some of the reasons for non-reporting:
- fear of disciplinary or compliance action
- lack of understanding of what constitutes a reportable incident
- lack of understanding of the importance of reporting
- complexity in reporting
- no incentive to report incidents.
AMSA is making ongoing efforts to ensure that barriers to reporting marine incidents are minimised. For example; reporting forms have been simplified and there is now an online way to submit reports. We are also using all our available avenues of engagement with industry to explain the importance of incident reporting and its links to safe operations.
Incident trends by severity
Severity level
Marine incidents are classified by AMSA into one of three severity levels, as described below:
Very serious incidents include loss of vessel, loss of life (fatalities) due to the operation of the vessel and serious pollution.
Serious incidents (none of the above) include serious injuries (operational), fire, explosion, collision, grounding, contact, heavy weather damage, ice damage, hull cracking, or suspected hull defect, critical equipment failure (i.e. main engines, steering gear), extensive accommodation damage, severe structural damage (penetration of the hull under water), loss of stability, pollution, and breakdown necessitating towage or shore assistance.
Less serious incidents (none of the above) include minor injuries, main engine stoppage for maintenance, minor contact, minor oil spills, and near misses.
Injury classifications
AMSA also classifies injuries into one of two categories as below:
Serious injuries include injuries that require emergency treatment, in most cases leading to an emergency medivac from the vessel, and/or hospitalisation.
Minor injuries (none of the above) may require first aid treatment on the vessel. Crew are able to continue working on the vessel without taking time off.
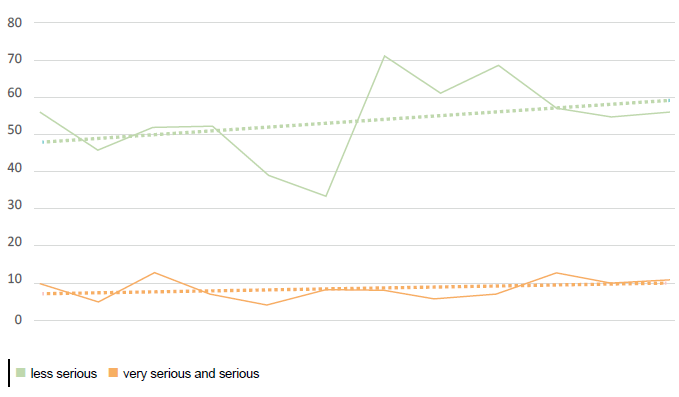
Figure 8 shows the monthly incident trend by severity. Initial indication is that the trend of less serious incidents being reported is increasing, while serious and very serious incidents are remaining steady. This is a positive trend as it indicates a slow but increasing awareness of the importance of reporting all marine incidents.
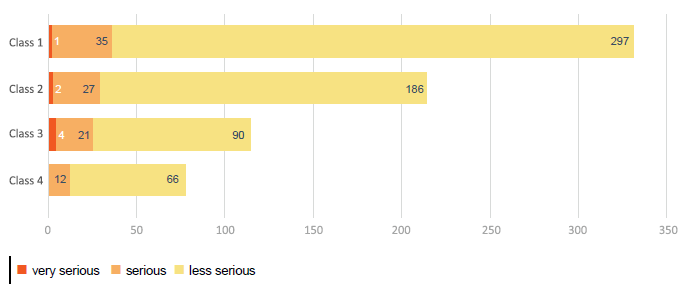
Overall, 639 (86.4%) marine incident reports were classified as less serious, 95 (12.7%) as serious and 7 (0.9%) as very serious. The proportion differs by vessel class (Figure 9), with a higher proportion of serious and very serious incidents (21.7%) attributed to Class 3 vessels.
Marine incident categorisation
Accidents and incidents are usually the result of a complex set of circumstances, often involving a chain of events. To gain a better understanding of what incident reports are telling us, AMSA categorises all incident reports into one or more ‘occurrence types’, to consistently describe the what happened in each incident. Classifying incidents in this way helps to understand patterns of what has taken place and identify potential areas for safety improvement.
The categorisation of incidents does not explain why a marine incident happened—it describes what has occurred.
Incident categories
The coding of all incident reports into occurrence types consists of a three-level hierarchy. The first level of the hierarchy is categorised into the following occurrence type groupings:
- Consequence
- Technical
- Operational
- Infrastructure and support
- Non-operational
- Environment
The table below provides a descriptor of each of the level 1 occurrence types.
| Level 1 occurence type groupings | Marine incidents related to: |
|---|---|
| Consequence | The impact / outcome of one of the other level 1 groupings below on one of the following (level 2 groupings): i) vessel (vessel consequence), ii) persons on the vessel (personal consequence) iii) environment (environmental consequence) OR iv) infrastructure (infrastructure consequence) |
| Technical | A technical failure / missing / defective vessel structure, equipment or system. |
| Operational | An operational shortfall. This is usually associated with an action someone did or did not do that impacted on the safe operation of the people and/or vessel. |
| Infrastructure & Support | A failure or issue with port, VTS, navigational aids and other infrastructure support facilities that directly affect vessel operations. |
| Non-operational | Other causes that are not directly related to the operations of the vessel (potentially piracy, acts of war) that impact the safe operation of a vessel. |
| Environment | External influences (weather, dangerous species) that have a direct impact on vessel and crew safety. |
Each of the level 1 occurrence types are sub-divided into a number of related level 2 occurrence types. In turn, level 2 occurrence types are further sub-divided into level 3 occurrence types. The hierarchical nature of the occurrence types is of fundamental importance, as it helps in the identification of trends. For example, a series of incidents may be seen to be unrelated as they reflect collisions with other vessels, collisions with wharves, and grounding. However, the underlying issue in all these incidents may be engine failure.
Figure 10 provides a visual representation of part of this framework with the level 1 occurrence type ‘Operational’, expanded into its level 2 and level 3 occurrence types.
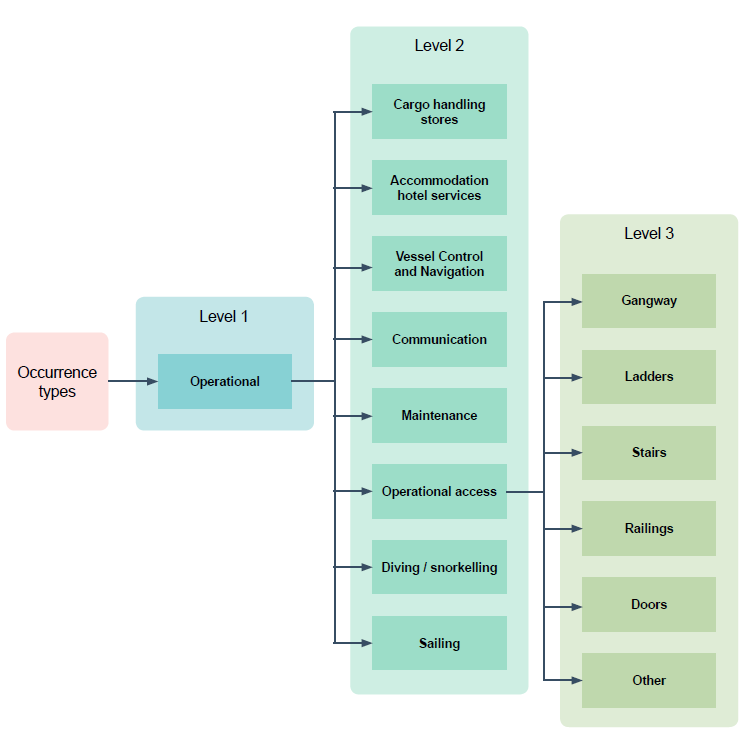
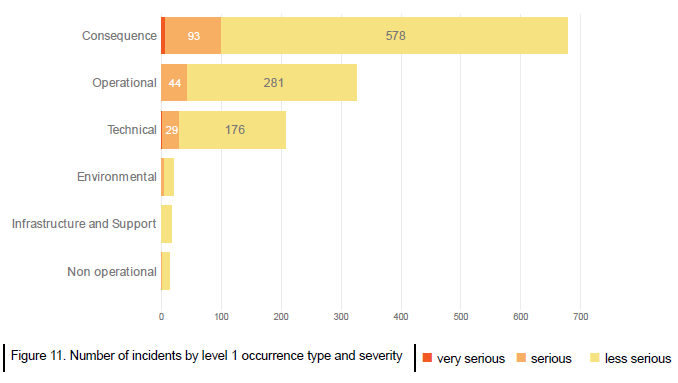
Figure 11 shows a breakdown of the 741 marine incidents into their level 1 occurrence types by severity4. Overall, the most common level 1 occurrence type associated with reported incidents is Consequence followed by Operational.
Occurrence types – Level 1
Analysis of occurrence types – Level 1
The next sections of this report detail each of the level 1 occurrence types focusing on Consequence, Operational and Technical groupings. The Environment, Infrastructure and Support and Non-operational will not be discussed individually due to the limited amount of data associated with these occurrence types.
Consequence to people
Some marine incidents result in consequences to the passengers or crew on-board. These consequences can include illness, injury, person over-board or fatalities.
Fatalities from 2015 to 2019 – people
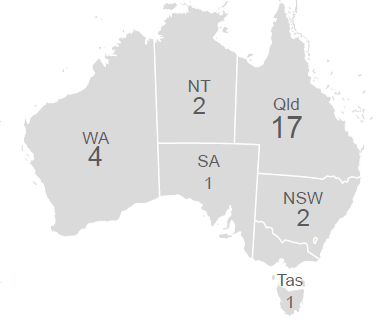
AMSA collects and records data on operational related fatalities5 on DCVs. Between 2015 and 2019, there were 27 (25 crew and 2 passenger) fatalities associated with 17 incidents. The majority of these fatalities (63%) occurred in Queensland (Figure 12).
Class 3 vessels accounted for the 21 out of the 27 fatalities (78%) during this period, 14 of which occurred in 4 incidents that resulted in multiple fatalities. All four of these incidents involved the sinking, capsize or loss of the vessel.
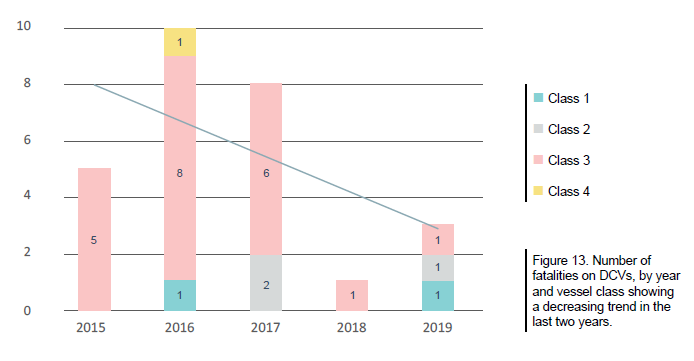
In the last two years (2018 and 2019), there has been a decreasing trend in the number of fatalities on DCVs.
Injuries 2019 – people
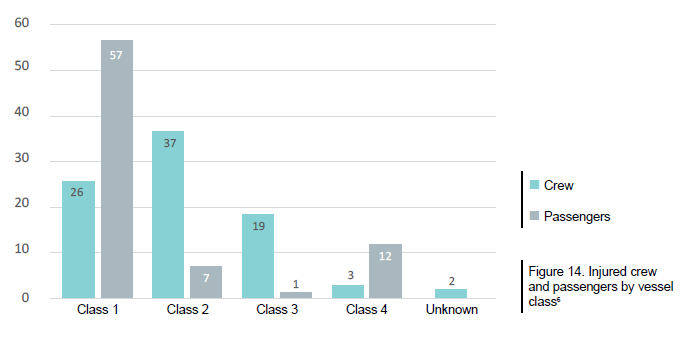
In 2019, a total of 164 non-fatal injuries were reported to AMSA. This included 87 injured crew and 77 injured passengers.
As previously discussed, injuries are classified as either serious or minor. In 2019, the majority of reported injuries were minor (54.3%) injuries with the remaining (45.7%) constituting serious injuries.
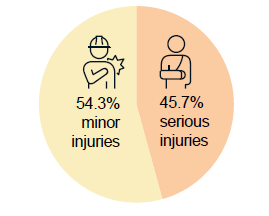
Figure 16 provides a proportion of injuries in relation to the proportion of the fleet in each state. While the majority of injuries (42.9%) occurred in Queensland waters, followed by New South Wales waters (25.2%) these two states account for the largest proportion of the DCV fleet.
Figure 17 details the circumstances under which injuries occurred7. The most common scenario for crew and passenger injuries was as a result of irregularities in vessel control and/or navigation. This includes issues with the handling or loss of control of the vessel, and issues with lookout and
collision avoidance. The second most common source of injury was contact with something other than another vessel (e.g. a wharf, a submerged object or a navigational beacon). The third most common circumstance under which an injury occurred was from a collision with another vessel.
Frequently, contact and collision events coincide with vessel control and navigation issues, which was identified as the most common circumstance for injury.
A safety alert was published by AMSA in early 2020 to raise awareness of the risks involved with getting on and off vessels.
Consequence to vessels
Figure 18 provides an overview of the vessel consequences as a result of a marine incident. The most common vessel consequence in 2019 was contact (34.9%) followed by collision (21.4%), grounding (13.9%), close quarters (10.5%), and flooding (7.7%). Of the contact incident types, 35.5% involved contact with a submerged object, 20.9% involved contact with a wharf and 12.9% involved contact with a navigational marker.
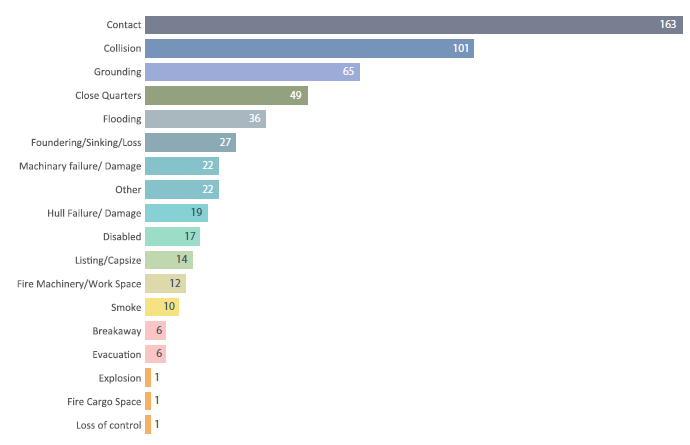
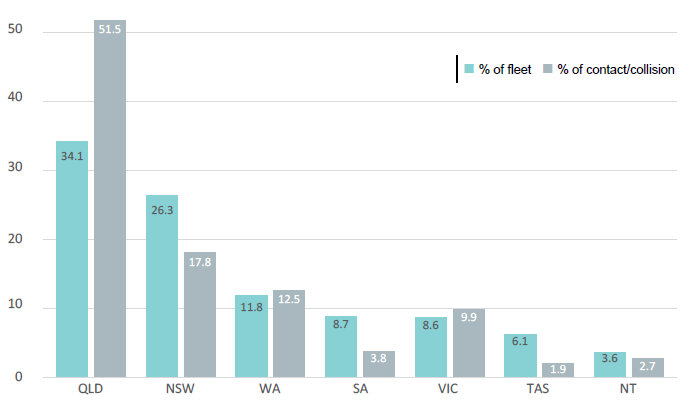
Figure 19 shows a breakdown of vessel contacts/collisions and fleet proportion by state. It shows that the largest proportion of these incident types (51.1%) occurred in Queensland.
Operational occurrence types
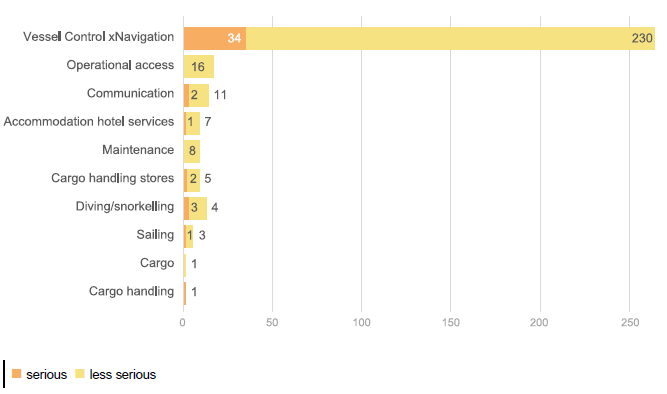
The most frequent level 2 occurrence type under the level 1 occurrence type Operational were vessel control and navigation (80.7%) (Figure 20) and operational access8 (4.9%). Vessel control and navigation also accounts for the majority (77%) of serious incidents involving an Operational occurrence type.
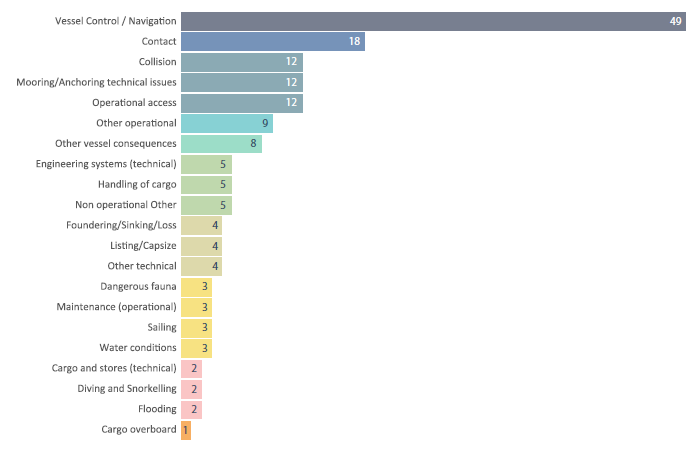
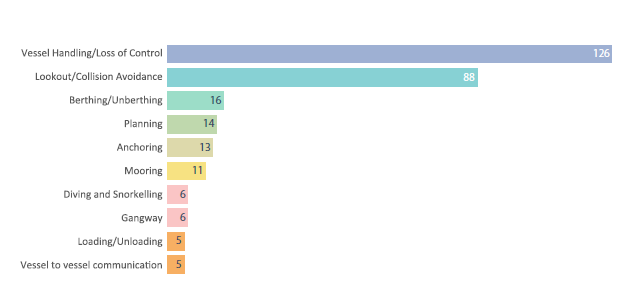
As shown in figure 21, Vessel handling loss of control and lookout/collision avoidance were the primary level 3 occurrence types contributing to incidents involving vessel control and navigation.
Technical occurrence types
Technical includes incidents that involve technical failures, missing or defective vessel structure, equipment or system. The most frequent Technical occurrence types include a failure or fault with the power propulsion and steering (45.6%), engineering systems (22.3%) and vessel systems
(20.9%). The majority of the very serious and serious incidents are associated with the most frequently occurring Technical failures.
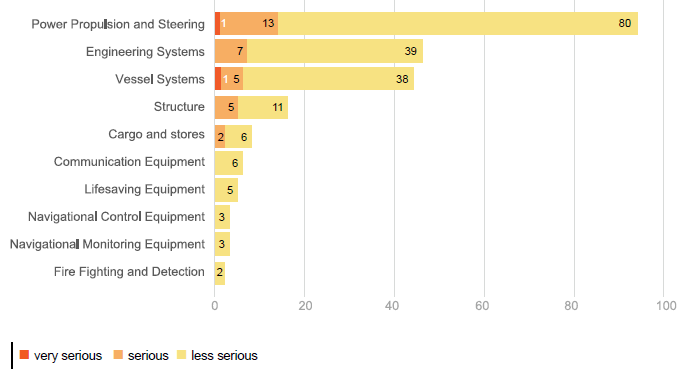
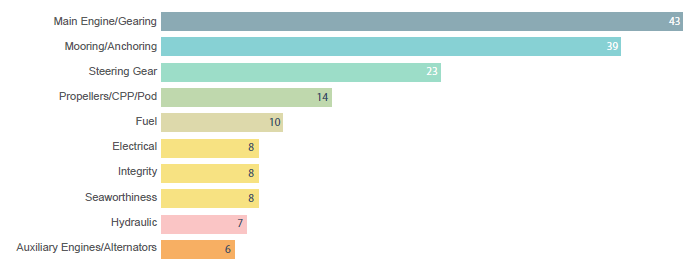
Figure 23 presents the top 10 most frequently occurring level 3 equipment/system faults that result in the above level 2 technical failures. Under power propulsion and steering, the level 3 occurrence types include main engine/gearing (43), steering gear (23) and propellers/CPP/Pod (14). Under Engineering Systems, the level 3 occurrence types include mooring/anchoring (38); fuel (10) and electrical (8).
Conclusion
This report provides an overview of the 2019 incident report data. In total, 741 reports were received during this period. There were three reported fatalities, showing a decreasing trend from previous data. A total of 164 injuries were reported, with the majority being minor injuries (54.3%)
with the remaining (45.7%) constituting serious injuries.
The information in this report highlights the importance of effective and timely marine incident reporting that supports a data driven insight and subsequent interventions aimed at improving safety. Reporting also assists AMSA in responding quickly and efficiently to a marine incident
when it occurs, and in some circumstances may support an investigation.
AMSA recognises the importance of collaborating with our stakeholders, and this includes educating our maritime community on safety matters. AMSA has leveraged information from marine accident reports and incident data to publish a range of safety information such as Safety Alerts and other publications. This information has also been used to inform engagement activities such as the recent Class 3 safety management systems workshops and the dory safety campaign.
The data presented in this report highlights that there is still progress to be achieved in terms of maritime safety in the DCV sector. The data also suggests that there is under-reporting of marine incidents. Hence, AMSA, in partnership with industry stakeholders, will to continue to work to
identify ways to improve reporting culture and subsequent safety outcomes.
Resources
The following resources are available:
1. Sections 88 and 89 of the Marine Safety (Domestic Commercial Vessel) National Law Act 2012, Schedule 1 (National Law).
2. Source: AMSA MARS system (April 2020)
3. See page 10 of this report for the definition of very serious and serious incident reports
4. Note that one incident may be coded into multiple categories.
5. These include fatalities associated with the operation of the vessel and are captured as a fatality occurring during a marine incident.
6. Note that these numbers indicate the number of people, not the number of incidents.
7. Note, since multiple occurrence types can apply to the same incident, some injuries may be counted in multiple categories.
8.Operational access is related to the provision of safe access for getting on and off the vessel. It is a legal requirement under the national law to provide safe access to a vessel.