Marine incident trends
In 2022 AMSA received a total of 1054 reports of marine incidents involving DCVs which is an increase of 11.5% from 2021 and represents a 41.5% increase in the annual number of incident reports from DCV’s since 2019 (Figure 2).
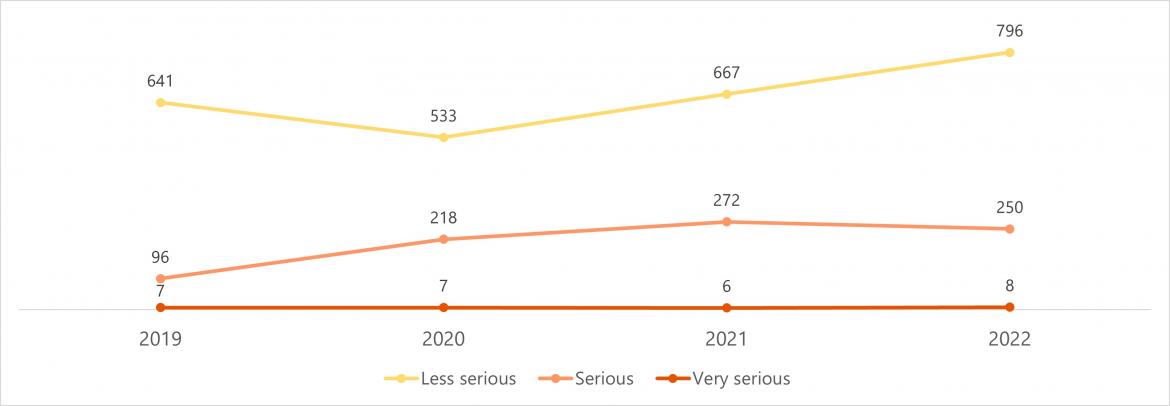 Figure 2 DCV incidents by severity (2019 - 2022)
In 2022
- there was an increase of 129 (4.9%) less serious incidents reported from 2021
- there was a decrease of 22 (5.1%) serious incidents reported from 2021
- very serious incidents remained low but did increase from 6 in 2021 to 8 in 2022.
When considering incident reports by vessel class (Figure 3, Tables 1 and A1) results show:
- In 2022, passenger vessels continue to demonstrate a good reporting culture in relation to all other classes of vessels. Passenger vessels which account for a relatively small proportion (9.1%) of the DCV fleet reported almost half (47.5%) of all DCV incidents in 2022. This represented an increase of 27.3% from 2021 in incidents reported from passenger vessels.
- In 2022, fishing vessels and hire & drive continue to be under-represented in marine incident reporting. Fishing vessels which account for 28.3% of the fleet reported 10.8% of all incidents in 2022. This outcome is consistent with 2021 data where fishing vessels reported 11.2% of all incidents. In 2022 fishing vessels reported 46.5% of serious incidents. This rate is 22.8% higher than the average rate of serious incidents reported across all vessel classes. Additionally hire & drive vessels which account for 13.8% of the DCV fleet reported 7% of all incidents in 2022.
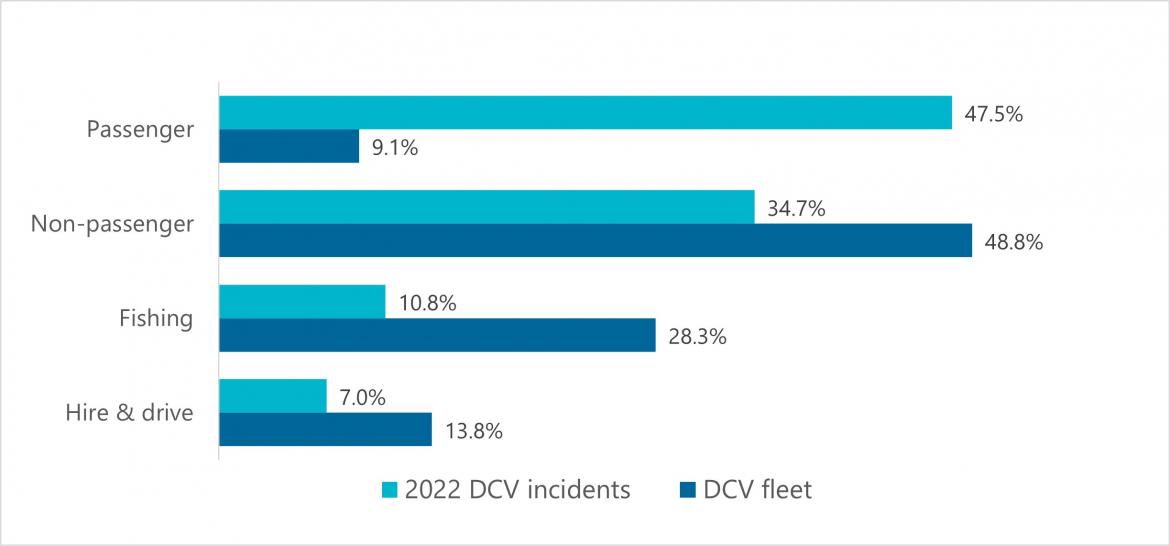 Figure 3 Proportion of incidents reported and vessels by class (2022)
| Vessel type | 2019 | 2020 | 2021 | 2022 |
|---|---|---|---|---|
| Passenger | 333 | 264 | 393 | 500 |
| Non-passenger | 217 | 313 | 371 | 366 |
| Fishing | 116 | 115 | 106 | 114 |
| Hire & drive | 78 | 66 | 75 | 74 |
The rate of incident reporting by State varied greatly across Australia (Figure 4, Table A2). Figure 4 shows the proportion of incidents reported by State with information added on the proportion of the fleet in each state. The highest rates of incident reporting were from QLD, NT and WA.
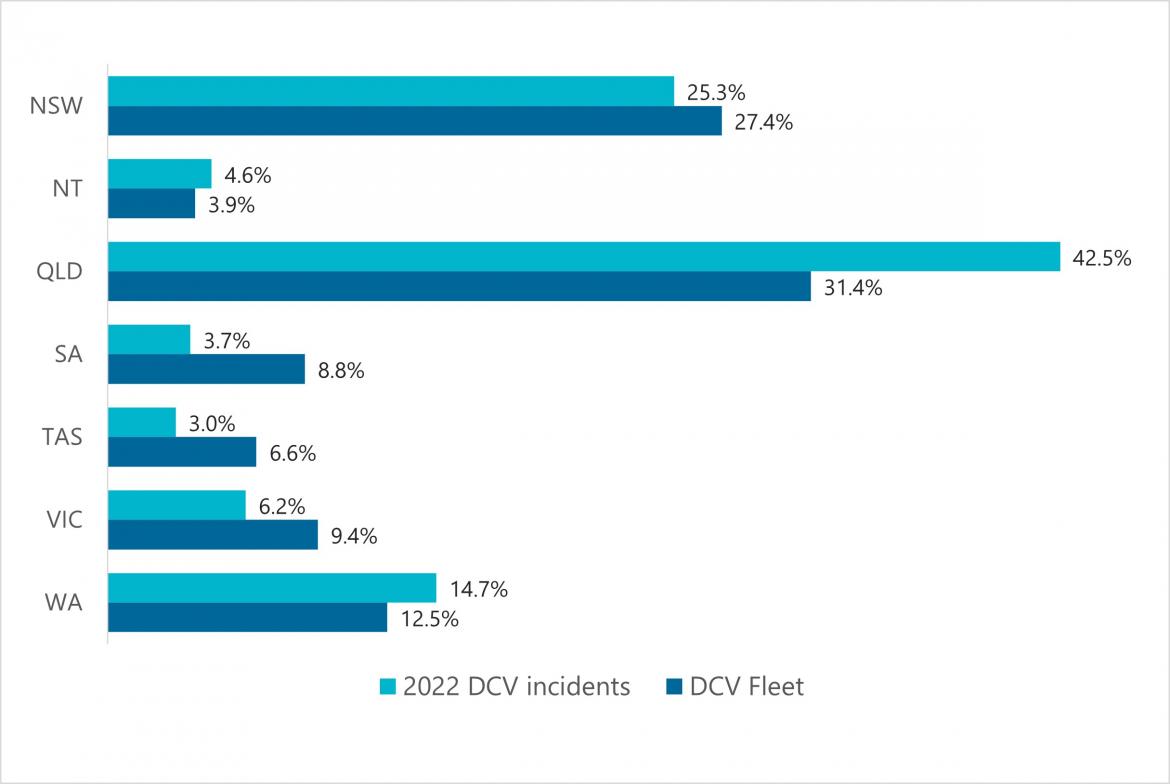 Figure 4 Proportion of incidents reported in 2022 and vessels by State