Fatalities
In 2022 there were no operational-related fatalities associated with DCV vessel operations.
Between 2018 and 2022, there were 11 operational-related fatalities on DCVs (9 crew and 2 passengers) associated with 11 marine incidents. Seven (63.6%) of these occurred on fishing vessels (Table 2).
Table 2 DCV fatalities by year, state and vessel class, (2018-2022)
NSW
| Vessel class | 2018 | 2019 | 2020 | 2021 | 2022 |
|---|---|---|---|---|---|
| Passenger | 0 | 0 | 0 | 0 | 0 |
| Non-passenger | 0 | 1 (passenger) | 0 | 1 (crew) | 0 |
NT
| Vessel class | 2018 | 2019 | 2020 | 2021 | 2022 |
|---|---|---|---|---|---|
| Non-passenger | 0 | 0 | 0 | 0 | 0 |
| Fishing | 1 (crew) | 0 | 1 (crew) | 0 | 0 |
QLD
| Vessel class | 2018 | 2019 | 2020 | 2021 | 2022 |
|---|---|---|---|---|---|
| Non-passenger | 0 | 0 | 1 (crew) | 0 | 0 |
| Fishing | 0 | 2 (crew) | 0 | 0 | 0 |
TAS
| Vessel class | 2018 | 2019 | 2020 | 2021 | 2022 |
|---|---|---|---|---|---|
| Fishing | 0 | 0 | 1 (crew) | 1 (crew) | 0 |
WA
| Vessel class | 2018 | 2019 | 2020 | 2021 | 2022 |
|---|---|---|---|---|---|
| Passenger | 0 | 0 | 0 | 1 (passenger) | 0 |
In 2022, the fatality rate (the number of fatalities per 100,000 crew employed on DCVs) was 1.8. This remains lower than the five-year average annual fatality rate of 2.7 per 100,000 crew7 and lower than the fatality rate for Agriculture, forestry & fishing and Transport postal & warehousing reported in 2021 (Table 3).
Table 3 Fatality rate per 100,000 crew employed on DCVs compared to similar industries8
Year of incident | Number of operational-related crew fatalities on DCV fatalities | Domestic commercial vessels fatality rate per 100,000 crew9 | Agriculture, forestry & fishing fatality rate per 100,000 workers | Transport, postal & warehousing fatality rate per 100,000 workers |
2018 | 1 | 1.5 | 11.2 | 5.9 |
2019 | 2 | 3.0 | 9.4 | 9.0 |
2020 | 4 | 6.1 | 13.1 | 7.8 |
2021 | 2 | 3 | 10.4 | 7.9 |
2022 | 0 | 0 | * | * |
Five-year average (2017-2021) | 3.4 | 5.2 | 12.1 | 7.8 |
Five-year average (2018-2022) | 1.8 | 2.7 | * | * |
Injuries
In 2022, 18.3% (196) of incidents on DCV’s included reports of an injury to a crew member or passenger.10
Table 4 Incidents on DCVs with reported injuries to a crew member or passenger, total and as a proportion of all incidents (2019-2022)11
Consequence | 2019 |
| 2020 |
| 2021 |
| 2022 |
|
| Total | % DCV incidents | Total | % DCV incidents | Total | % DCV incidents | Total | % DCV incidents |
Injury to crew | 84 | 11.3% | 78 | 10.3% | 108 | 11.4% | 114 | 10.8% |
Injury to passengers | 65 | 8.7% | 52 | 6.9% | 72 | 7.6% | 82 | 7.8% |
Injury (total) | 148 | 19.9% | 131 | 17.3% | 179 | 18.9% | 193 | 18.3% |
In 2022 the total number of injuries reported to AMSA increased by 32.0% from 2021. This is largely due to reports of injuries to passengers (Figure 5).
In 2022 the total passenger injuries reported increased by 68.1% from 2021. This is mainly due to a single incident involving a high-speed thrill ride in which a high number of passenger injuries, including serious injuries were sustained. This single incident also accounted for a 100% increase in serious injuries to passengers in 2022 from 2021. The number of serious injuries to crew has increased from 39 in 2021 to 44 in 2022 but generally has remained more or less steady across the last 4 years.
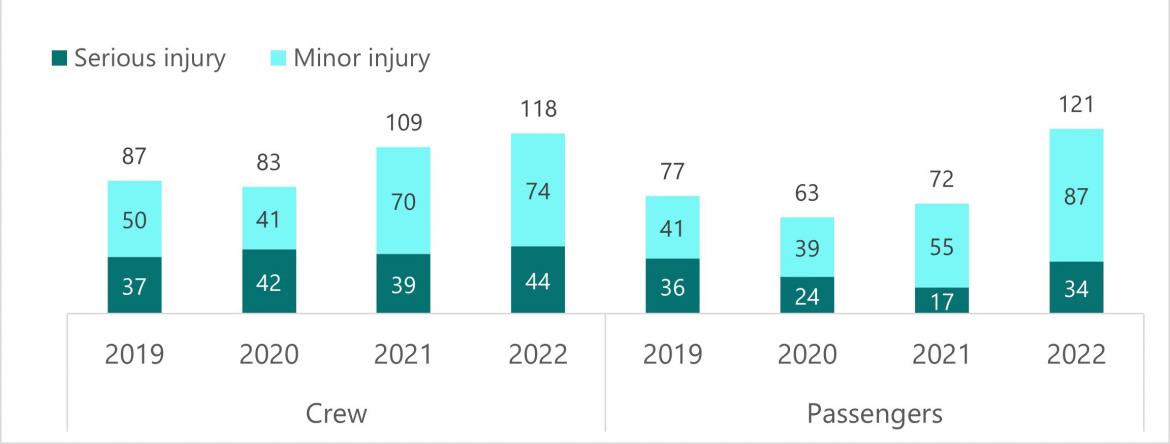
More than half (54.5%) of the serious crew injuries in 2022 were reported by non-passenger vessels, followed by fishing (27.3%) and passenger (18.2%) vessels.
In 2022, most crew injuries were associated with shortfalls in the control and navigation of the vessel (36.9%) followed by operational access (25.2%) and cargo handling and stores (17.5%) (Figure 6). Examples of injuries associated with the control and navigation included head injuries requiring medevac when a vessel ran aground on a reef at speed, the vessel was navigating using an old route in plotter that hadn’t been reviewed prior to sailing. In another instance a sole operator was thrown overboard and sustained serious foot and chest injuries when their attention was diverted from navigating the vessel after they dropped their phone. Whilst looking at deck to retrieve phone, the vessel made heavy contact with a navigation marker.
Examples of injuries associated with operational access were broken fingers and hand when an unsecured hatch closed on a crew member’s hand with the hatch strap flicking onto hand and breaking fingers. There were several instances of crew members slipping on fenders or gunwales when transferring between vessels and landing in water or heavily on deck, slipping and falling heavily on engine room ladders due to oil residue on boot or on ladder.
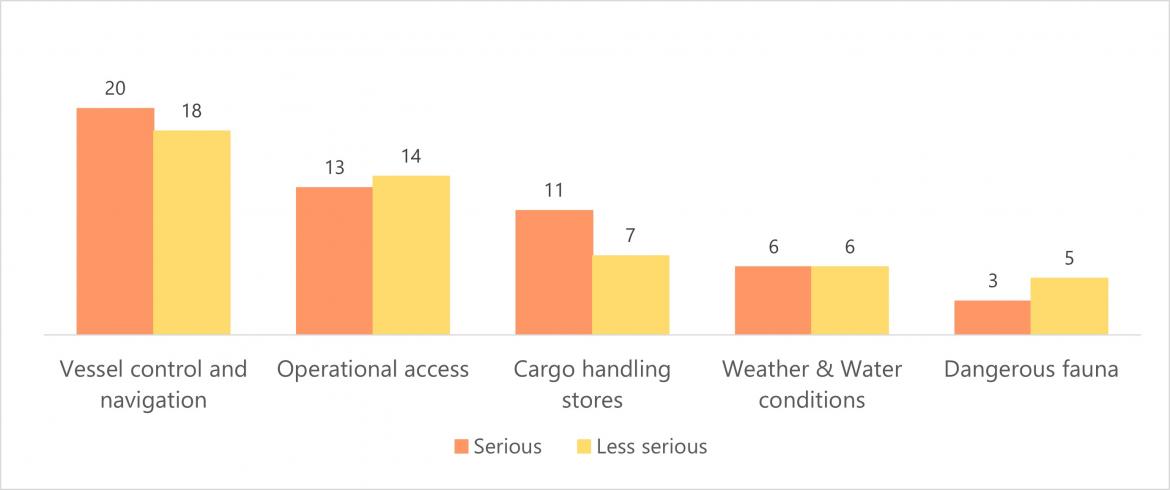
This pattern was similar across all classes of vessels except for fishing, where most injuries were associated with Cargo handling and stores (44.4%) followed by Dangerous fauna (22.2%) and Vessel control and navigation (Table A3).
Persons overboard
In 2022 AMSA received 87 reports of incidents involving person overboard (POB) from DCVs representing a 19.2% increase from 2021. Passenger vessels reported the majority (50.7%) of all POB incidents.
In 2022, 17 POB incidents were classified as ‘intentional’ and 70 were classified as ‘unintentional’.12
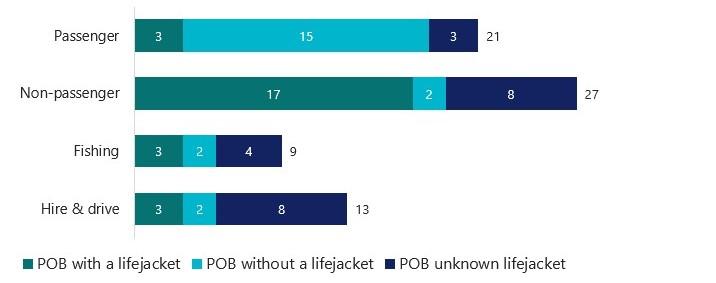
Of the 70 ‘unintentional’ POB incidents (Figure 7, Table A4):
- 39 involved crew members overboard
- 21 involved persons overboard not wearing a lifejacket and 22 where unknown if wearing a lifejacket
- 19 involved crew members who were wearing a lifejacket
- 6 involved passengers who were wearing a lifejacket
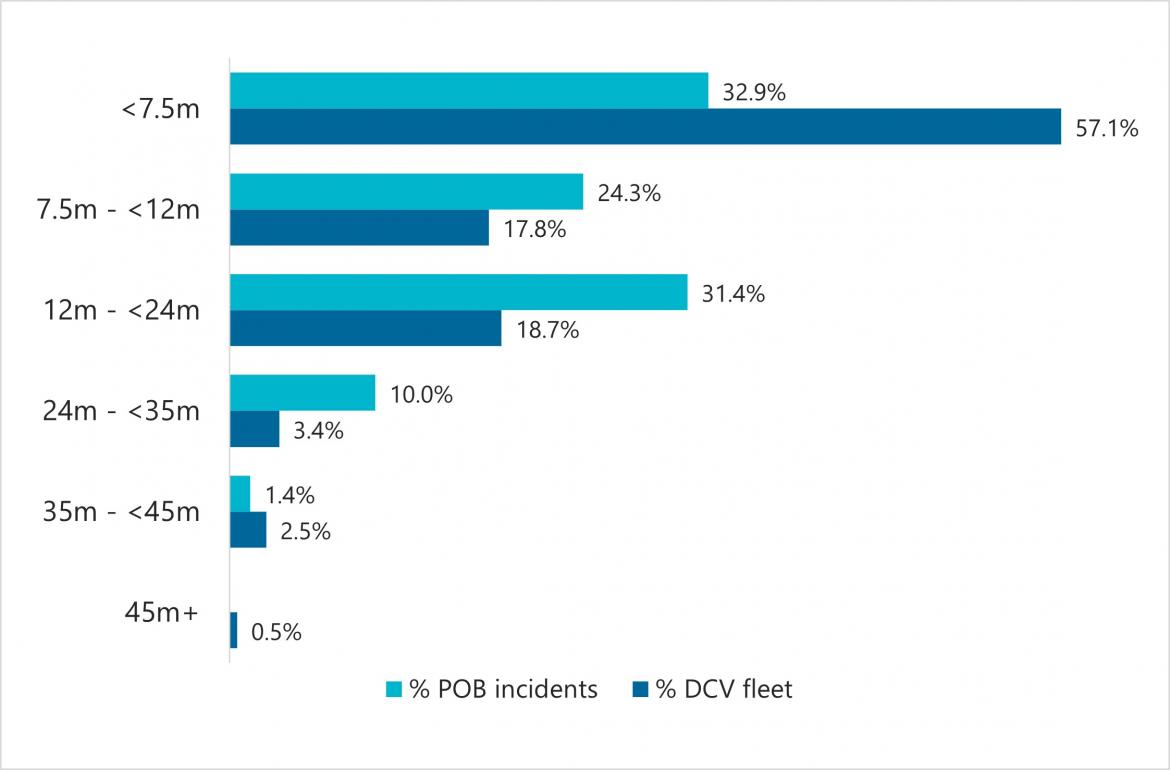
- 46 involved vessels between 7.5m and 35m in length, with vessels in this group making up 39.9% of DCV’s (Figure 8)
- 6 incidents involved crew and 12 involved passengers overboard where it was reported that more than one person entered the water
Footnotes
7. The actual number of fatalities must be considered when interpreting the fatality rates for this data due to the difference the size of the respective workforces. As noted in Work-related traumatic injury fatalities Australia 2021 by SafeWork Australia, fatality rates are sensitive to the number of people employed in the industry. In smaller industries that employ fewer employees (such as in the DCV fleet), a small variation in the number of fatalities produces an apparent larger variation in the fatality rate. Compared to the estimated 66,000 crew engaged in the DCV fleet, agriculture/forestry and fishing fatality rates are calculated from nearly five times the number of workers (approximately 317,300) and transport/postal and warehousing rates from nearly ten times (approximately 658,200).
8. Safe Work Australia (SWA), Work-related Traumatic Injury Fatalities Australia, 2021, SWA, Government of Australia, 14 November 2022, accessed 6 June 2023.
https://www.safeworkaustralia.gov.au/doc/work-related-traumatic-injury-fatalities-australia-2021; SWA 2022 data not yet available at time of publication of this report.
9. Based on a calculated approximation of 66,000 crew engaged on domestic commercial vessels.
10. All incidents reporting serious operational injuries to crew or passengers are classified as serious.
11. Incidents may report injuries to crew and passengers. In both 2019 and 2020 AMSA received one report of an injury to a stevedore in relation to the operation of a DCV.
12. AMSA classifies a POB as unintentional when the persons going overboard was associated with of the operation of the vessel.