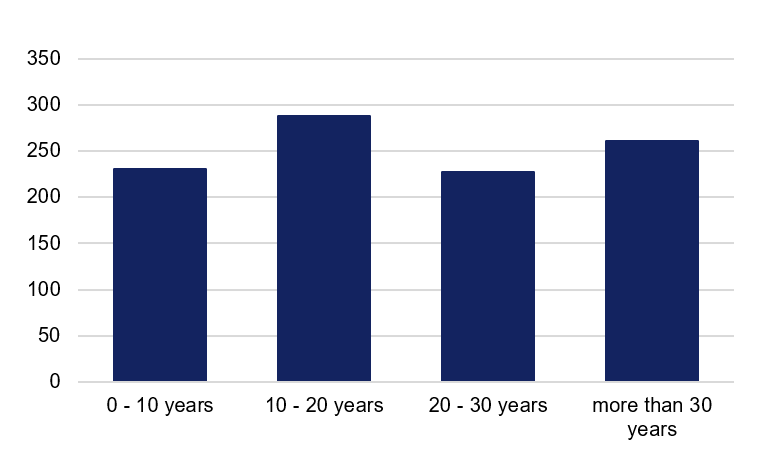
The average age of survey respondents was 46 years and there was a good range of seagoing experience. As shown in figure 1, 23% (totalling 231) of respondents stated they had between up to 10 years’ experience, 28% (288) of respondents had 10 to 20 years, 22% (227) of respondents had 20 to 30 years, and 25% (261) of respondents claimed over 30 years’ seagoing experience.
Participation
Senior crewmembers were heavily represented in this survey with most of the respondents coming from masters of vessels (64% or 657 respondents). The next two role/ranks were engineers (14%, 141 respondents) and ratings/deckhands (also 14%, 139 respondents).
Location of respondents
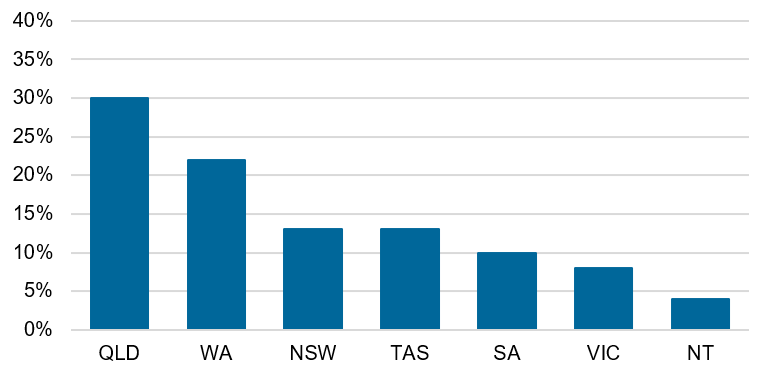
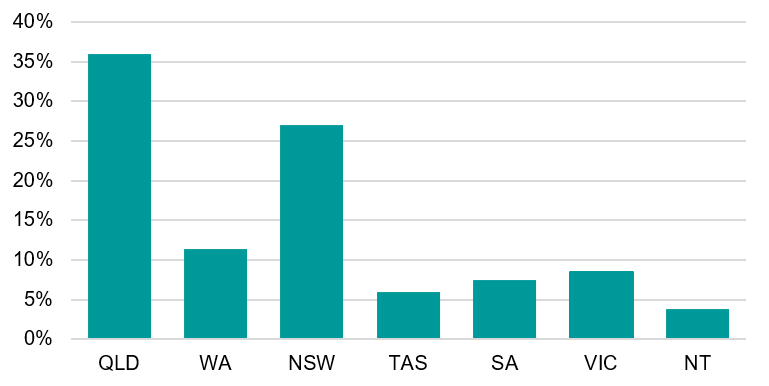
The location of respondents was spread across Australia as shown in Figure 2. 30% (308) of respondents were from Queensland, 22% (223) were from Western Australia, 13% each from Tasmania (135) and New South Wales (129), 10% (105) from South Australia, 8% (83) from Victoria and 4% (38) from the Northern Territory. Four of the seven States/Territories were roughly represented given the proportion of the domestic commercial vessel fleet. There was underrepresentation in New South Wales and Queensland and over-representation in Western Australia, Tasmania, and South Australia (see Figure 2 and Figure 3).
Vessel class and operational area
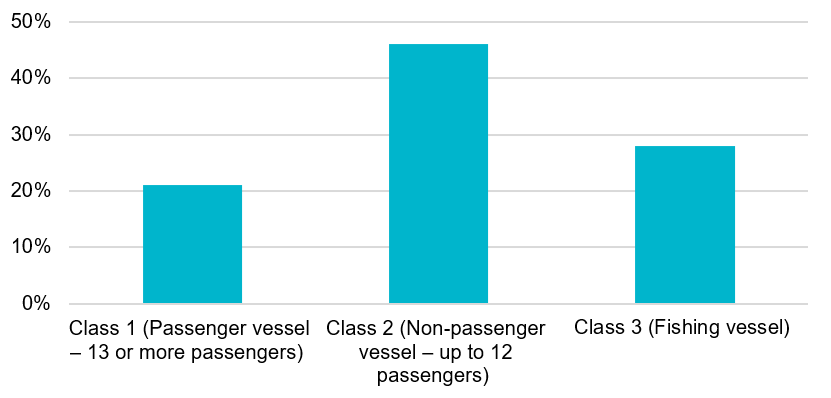
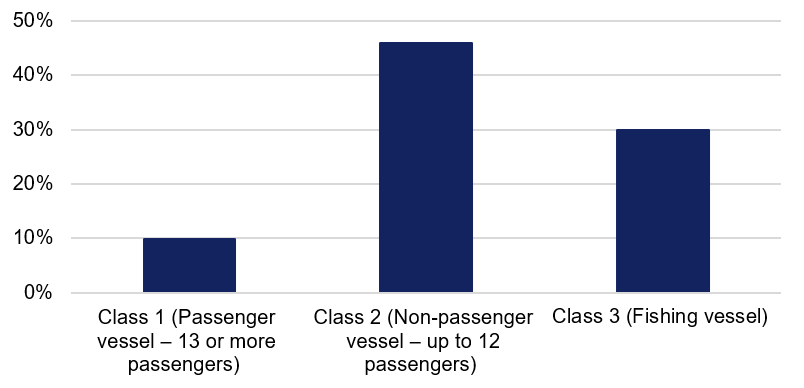
As shown in Figures 4 and 5, Class 2 and Class 3 vessels respondent percentages matched their proportional representation as part of the domestic commercial vessel fleet (46% (474) Class 2 vessels, 28% (288) Class 3 vessels). Class 1 respondents were overrepresented (21% (216) Class 1) when compared to the proportion of that fleet.
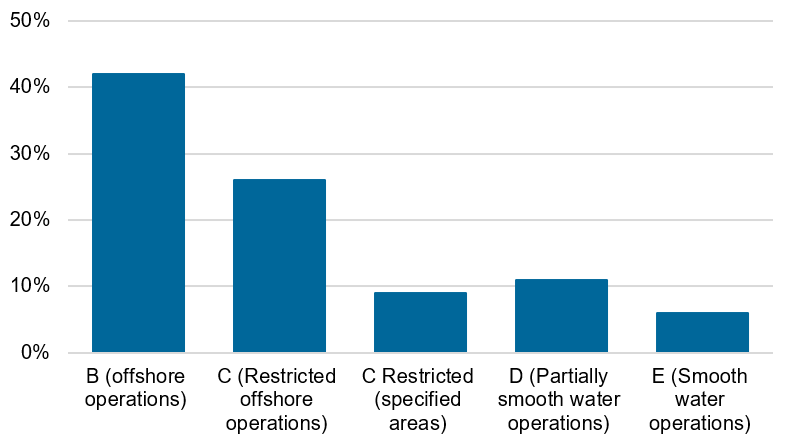
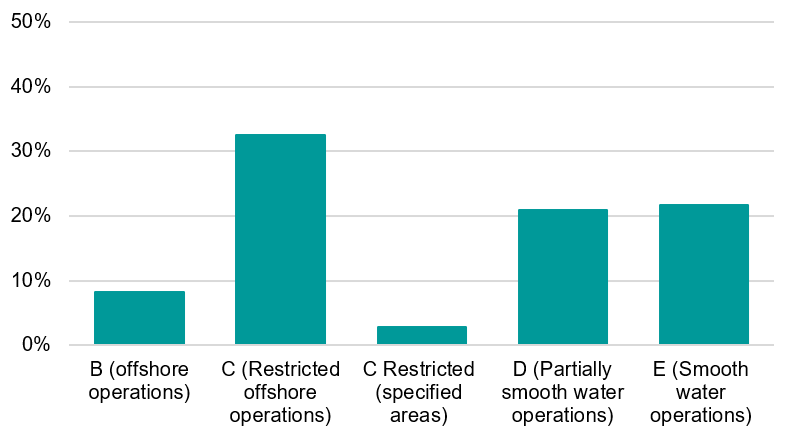
As shown in Figures 6 and 7, respondent’s operational areas in this survey were not representative of the proportion of the domestic commercial vessel fleet. The respondent percentages closest to being representative were operational area C respondents working restricted offshore operations within 30 nautical miles from shore at 26% (270) with the proportion of the fleet being 32.5%.
Length of trips at sea
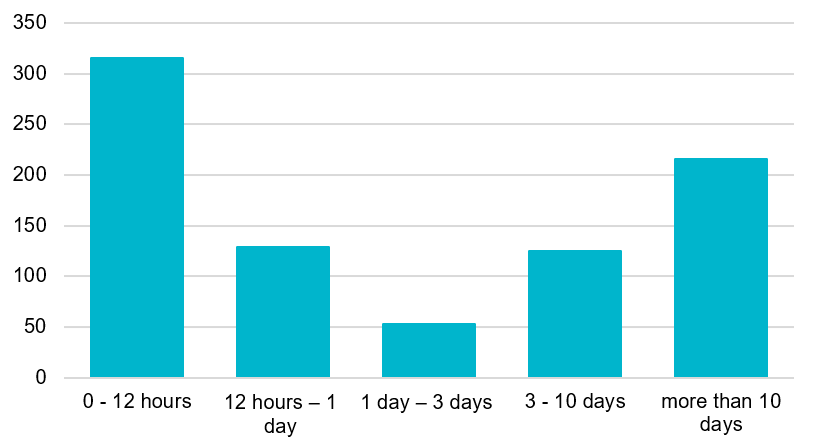
Respondents were asked to indicate how long they were out at sea per trip. 31% (315) of respondents stated that their trips were less than 12 hours. 13% (129) of this category stated that they were out at sea between 12 to 24 hours, 5% (53) were out from 1 to 3 days and 33% (341) stated they were at sea from 3 to more than 10 days (Figure 8).