Approach
As well as the principles in methodology detailed in Appendix 2, an effective model must be:
- Robust – in addition to the allocation of direct costs, a model must be capable of reliably allocating indirect and corporate overheads to direct activities,
- Defensible – assumptions and approach applied in determining cost allocations must be clearly documented and capable of withstanding external scrutiny, and
- Repeatable – model must be capable of supporting a repeatable process in future periods.
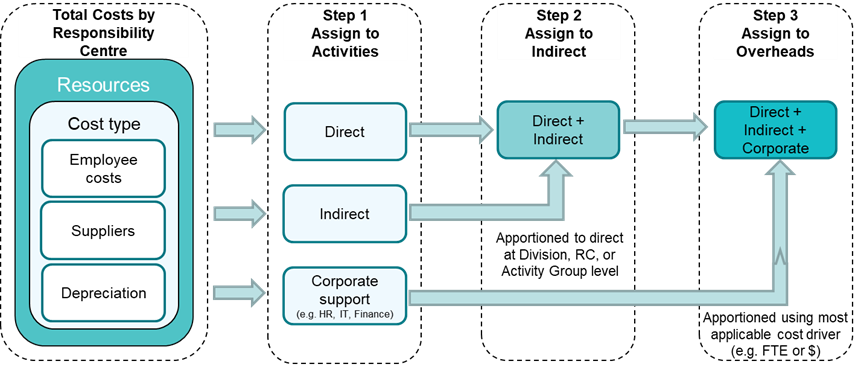
An illustration of the model approach applied in 2021-22 is detailed below.

Data collection and collation
The typical approach is to use data collection systems, such as timesheets, to gather information about drivers and use this for the allocation of costs to activities. AMSA does not currently collect timesheet data. Instead, the approach applied in 2021-22 is to use a data collection template with direct input from each business line area manager.
Managers assigned staff and employee costs (based on ASL equivalent grades), and supplier costs to activities and activity groups. During this data collection phase, managers provided:
- reasons why AMSA performs the activity, including how it is funded,
- whether the activity is ongoing, commencing, or terminating,
- description of activity drivers, including expected volumetric data per annum, expected impacts (risks, quality, benefits, service levels…etc.) for scenario levels, and justification for using the driver,
- risk assessment, identifying risk of not performing the activity, and
- corporate focus area aligning with Corporate Plan.
Overhead model
The collation of data collection templates determined direct costs for each activity output. To calculate fully absorbed costs of an activity output, an attribution of indirect and corporate support costs to each direct activity based on drivers is required. The overhead model applies several cost drivers.
Allocation of indirect support costs
Activity groups are used to assembly similar activities for the purposes of allocating indirect support costs to direct activities. There are two levels of activity groups to provide options in accurately assigning costs:
- Activity group 1 – set at the highest level at which common activities can be identified.
- Activity group 2 – sets a lower level to allow for a more targeted approach to overhead allocation. It also allows for activities to be split between international and domestic industries.
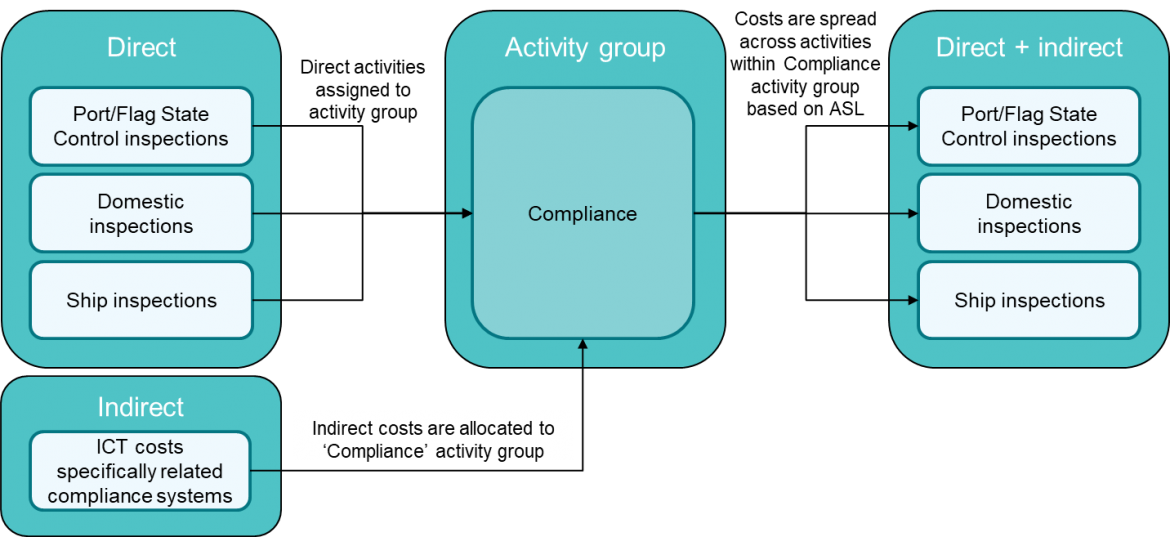
Currently, indirect support costs are assigned to direct activities using direct ASL of that respective activity group as a cost-driver. The model has the flexibility to assign dollar values to specific individual activity groups. However, at this stage, ASL deemed the most appropriate as costs are influenced by the number of staff.
Where costs are incurred solely to support a specific group of activities, such as ICT hosting and support of software, the activity group is used to assign costs – as illustrated below.

The following indirect costs have been allocated in the model utilising activity groups:
- Support activities (excluding corporate overhead functions) required for the delivery of a group of activities, such as divisional management and administrative costs,
- Depreciation costs for assets that directly support a group of activities, and
- ICT operating expenditure on projects and systems that directly support a group of activities.
Property operating expenditure
Given its role, AMSA operates at numerous locations throughout Australia, leasing offices and storage facilities, as well as owning eight remote residential properties and one regional office. This corresponds to a sizeable property footprint and associated operational expenditure.
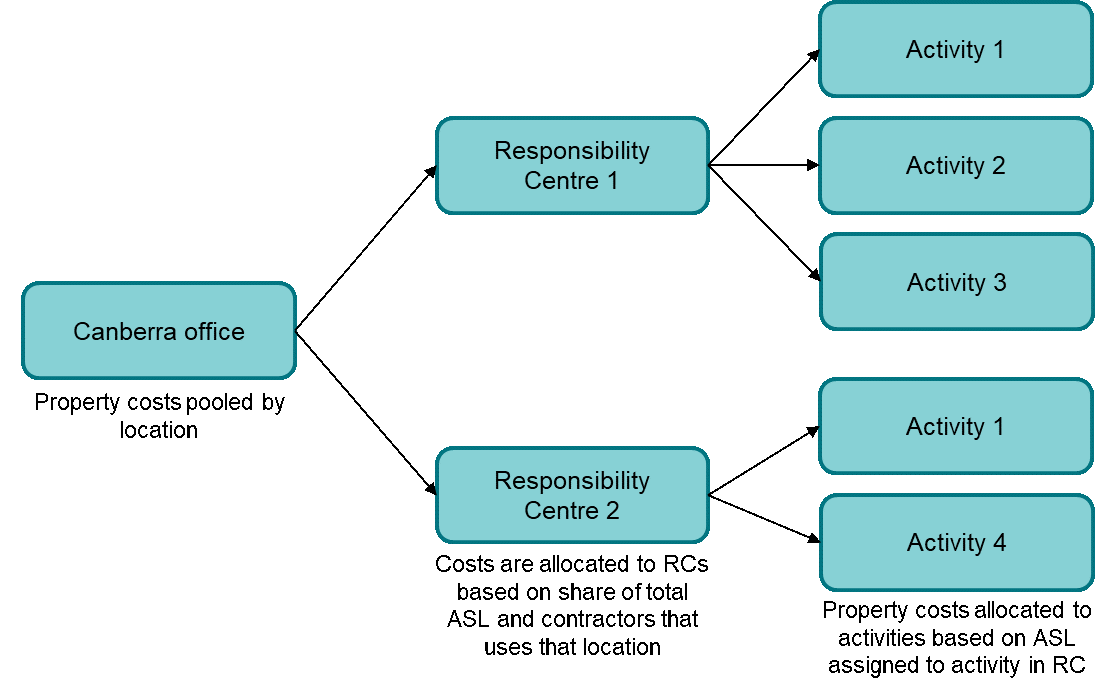
Property operating expenditure for office leases and residential properties are allocated by aggregating costs by location, and then directly allocated to each business line area in proportion of the respective number of staff and contractors utilisation that location – below is an illustration of this process.

Property operating expenditure for direct activities, such as aids to navigation sites or leasing space for National Plan stockpiles, are allocated directly to their respective activity outputs.
Corporate overheads
Corporate overheads allocated to direct activities using several cost drivers, depending on the nature of the expenditure, detailed below.
Overhead category | Allocation method | Rationale |
Executive functions | Dollar cost (direct + indirect) | Dollar costs appears the most reasonable given executive functions focus on strategic and risk, which is usually dictated by expenditure. |
Human Resources (HR) | ASL | Cost and resourcing of HR functions heavily influenced by volume of staff that are supported (e.g. payroll, recruitment, training, and performance management). |
Finance | Dollar cost (direct + indirect) | Primarily focused on areas of higher spend and risk. A higher cost requires ongoing financial management arrangements. While dollar cost for the allocation method is not a perfect cost driver, it provides a more accurate allocation than simply using ASL. |
Governance | Dollar cost (direct + indirect) | Focuses effort on organisational priorities and risk, with corporate planning the output. Strategically important activities receive additional management and analysis compared to lower risk (and generally lower cost) activities. ASL deemed unreasonable as governance function activities are not influenced by the number of staff. |
ICT general (excluding directly attributed activities) | ASL | Driven by the volume of staff and contractors supported (e.g. issuance of computers, help-desk requests, telephony and communications costs). |
Attribution of costs to non-regulatory charging activities
Staff providing regulatory charging activities may also undertake other activities funded by either government budget appropriations (search and rescue coordination services and regulatory function National System activities) or Australian Government agencies for targeted externally funded maritime related programs.
Costs for non-regulatory charging activities are identified during the collection and collation phase by direct input from business unit managers, with indirect and corporate overheads treated in the exact same manner as regulatory charging activities. This holistic approach (mentioned in Appendix 2) ensures a comprehensive model fulfilling multiple demands for costing, with no risk of omitting any costs from total activity outputs.
Sensitivities
Cost drivers and assumptions underlying the modelling are developed to limit and constrain any significant sensitivity from changes in demands of regulatory charging activities. Nevertheless, it is recognised that costs are sticky in the short-to-medium timeframe, predominately consisting of contracted suppliers and staff.
Supplier costs are largely longer-term contracts where expenditure relates to service requirements or deliverables. These are generally not dynamic or responsive to short-term changes in demand of regulatory charging activities. Staff costs have a similar constraint for short-term movements and are based on long-term expected time and effort requirements to meet policy outcomes to an acceptable standard, as identified by business unit managers.
In determining the staff and supplier cost levels, AMSA forecasts the expected level of demand for regulatory charging activities as part of its annual budgeting processes. This process is based on historical data and trends, consultation advice, understanding known economic factors, and thorough communication with principle stakeholders. Although, externalities, such as COVID-19 disruptions, trade disputes, or austerity measures may impact resourcing and service delivery.