Some marine incidents result in consequences to the passengers or crew on board. These consequences can include fatalities, person overboard and/or injuries.
Fatalities (2016 to 2020)
Between 2016 and 2020, there were 26 fatalities (24 crew and 2 passenger) associated with 18 marine incidents. While there has been an increase in fatalities between 2019 and 2020, overall the number of fatalities has been trending downward since 2016.
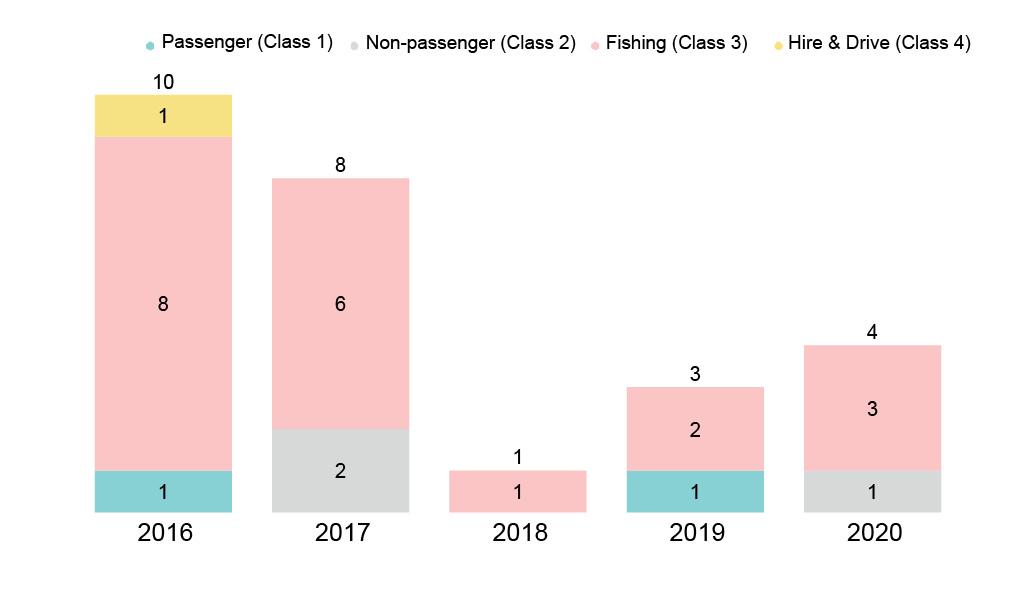
Fishing vessels (Class 3) accounted for 20 of the 26 fatalities (76.9%) during this period.
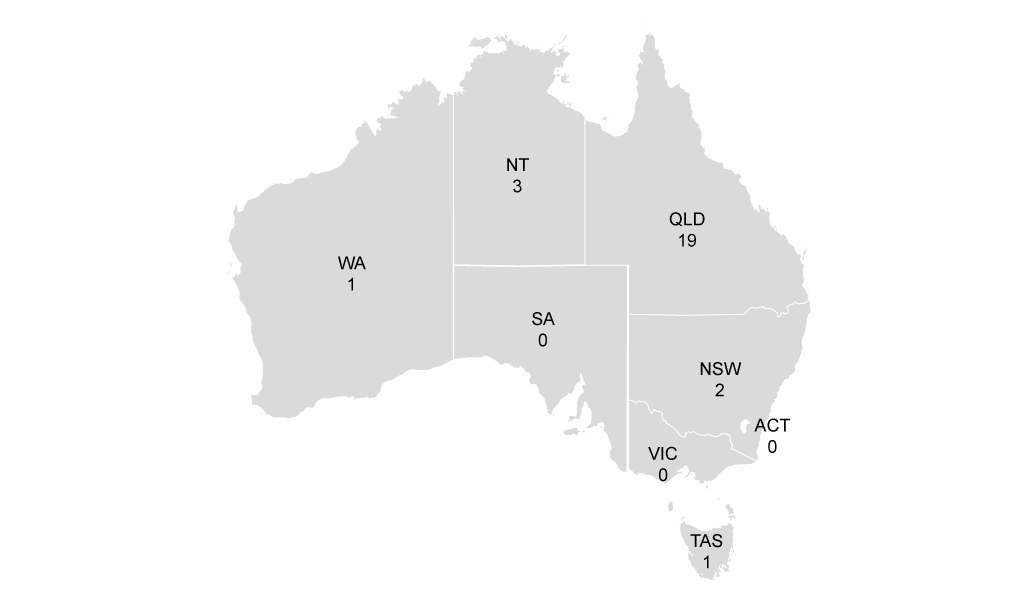
Most of the fatalities (73.1%) between 2016 and 2020 occurred in Queensland (Figure 13). The majority (41%) of fishing vessels are also based in Queensland.
In 2020 there were four fatalities, all involving a crew member going overboard. Three crew fatalities occurred on fishing vessels and involved (1) a tender (<7.5 metres), (2) a solo operator and (3) a crew member working over the side. The fourth fatality occurred on a charter vessel (class 2) and involved a person being knocked overboard by a sailing boom. In all these incidents none of the persons involved were wearing a life jacket.
In 2020, the fatality rate (the number of fatalities per 100,000 crew employed on DCVs) was 6.1. This is lower than the five-year average annual fatality rate of 7.34 per 100,000 crew as per Table 1.
Whilst this fatality rate of 6.1 is lower than Australia's transport/postal and warehousing rate of 7.5 and agriculture/forestry and fishing rate of 13.9, it is higher than the Australian national workplace fatality 5-year average rate of 1.5.
However, as also noted by SafeWork Australia5, fatality rates are sensitive to the number of people employed in the industry and this may be particularly evident with small variation in the number of fatalities for smaller industries that employ fewer employees (such as in the DCV fleet). Compared to the estimated 66,000 crew engaged in the DCV fleet, agriculture/forestry and fishing fatality rates are calculated from nearly five times the number of workers (approximately 329,600) and ten times the number of workers in transport/postal and warehousing (approximately 666,700)6. Therefore, the actual number of fatalities needs to be considered when interpreting the fatality rates for this data.
| Year of incident | Number of operational-related crew fatalities on domestic commercial vessels | Domestic commercial vessels fatality rates per 100,000 crew7 | Agriculture, forestry and fishing fatality rates per 100,000 | Transport, postal and warehousing fatality rates per 100,000 |
|---|---|---|---|---|
| 2016 | 9 | 13.6 | 14.3 | 7.4 |
| 2017 | 8 | 12.1 | 16.5 | 8.6 |
| 2018 | 1 | 1.5 | 11.2 | 5.9 |
| 2019 | 2 | 3.0 | 9.1 | 8.7 |
| 2020 | 4 | 6.1 | * | * |
| Five-year average (2016-2020) | 24 | 7.3 | 13.9 (2015-2019) | 7.5 (2015-2019) |
*Data not yet available at time of publication of this report.
Since AMSA took service delivery in mid-2018, the 3-year average fatality rate per 100,000 crew on domestic commercial vessels is 3.5 (2018-2020).
Persons Overboard - 2020
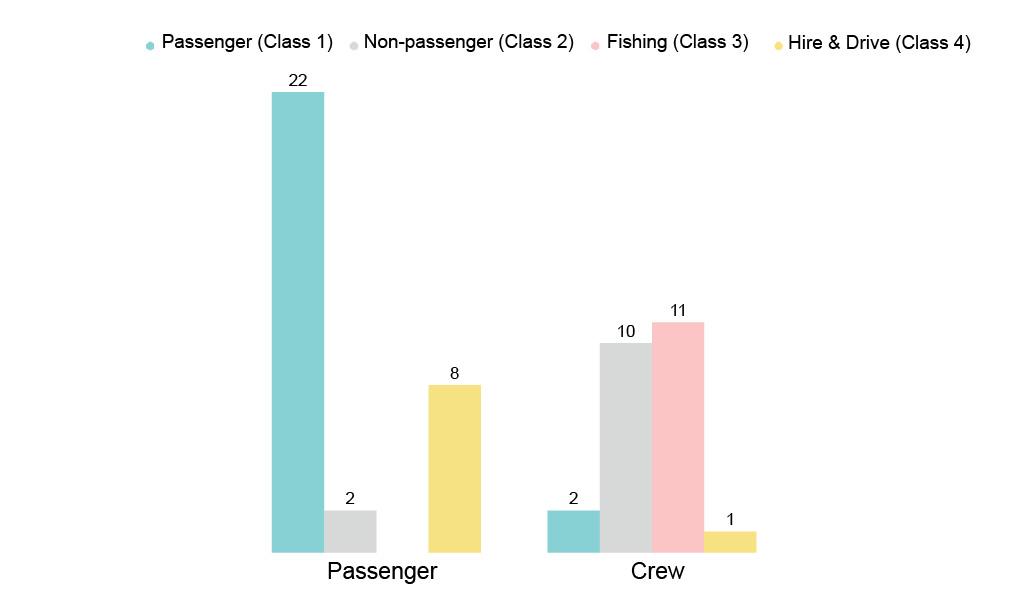
In 2020, there were a total of 44 marine incidents reported involving 56 persons overboard. 52 of these persons were recovered and four were fatal incidents. Of the 56 persons overboard, 42.9% fell overboard from passenger vessels.
Person overboard incidents resulted from vessel capsize/sinking (28.8%), collisions (13.5%), boarding/disembarking (11.5%), vessel handling (9.6%) and loss of balance (9.6%).
There were also a total of 14 passengers that deliberately jumped overboard (this data is excluded from Figure14 below). In almost all of these circumstances alcohol/drugs or an altercation were involved.
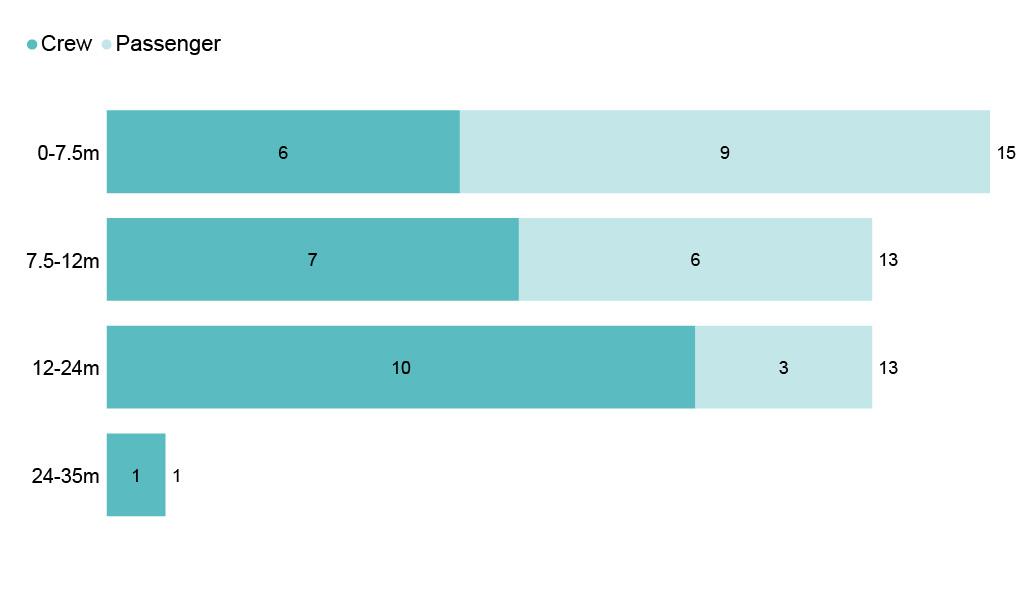
As shown in Figure 14, most person overboard incidents (35.7%) occurred on vessels less than 7.5 metres in length. More than 50% of reported person overboard incidents were on vessels less than 12 metres in length. The significant risks associated with persons overboard from smaller vessels is supported by research8. Additionally, the effectiveness of using a lifejacket appears to correlate with vessel size9. This means that wearing a lifejacket has been shown to provide better safety outcomes on smaller vessels.
Injuries in 2020
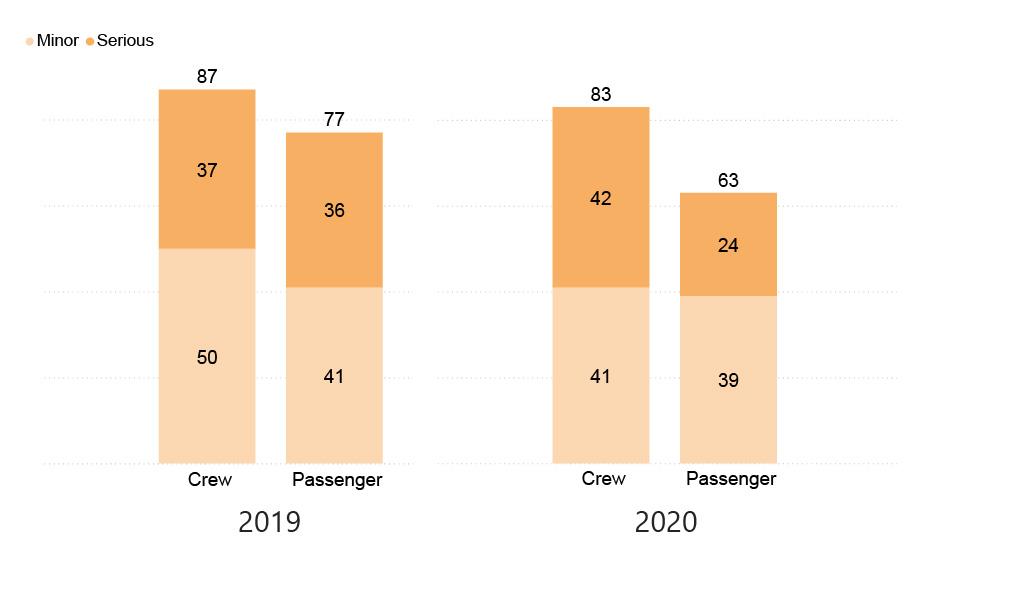
In addition to fatalities and persons overboard, injuries are a third possible consequence to people. In 2020, a total of 146 injuries were reported to AMSA, with 83 being crew and 63 passengers. As shown in Figure 15, this is 11% lower than the 2019 data.
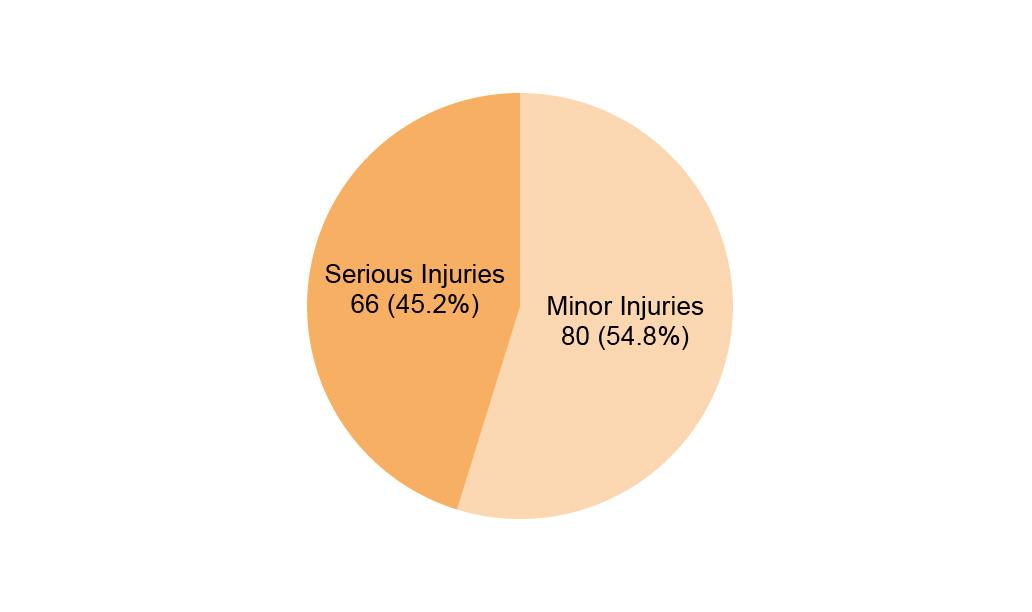
AMSA classifies injuries into serious and minor injuries. Serious injuries include injuries that require emergency treatment, in most cases leading to an emergency medivac from the vessel, and/or hospitalisation. Minor injuries do not require emergency treatment but may require first aid treatment on the vessel. Crew can continue working on the vessel without taking time off for a minor injury.
In 2020, the majority of reported injuries were minor (54.8%) with the remaining (45.2%) constituting serious injuries. It is anticipated that serious injuries are more likely to be reported by the owner/operator than minor ones due to the visibility of the event.
As shown in Figure 17, most injuries (minor and serious) occurred on non-passenger (class 2) vessels (43.2%). Non-passenger vessels represent 33% of the DCV fleet and 41.3% of the total reported incidents in 2020.
The proportion of reported serious injuries to minor injuries is highest on fishing vessels (65.5%) followed by non-passenger vessels (55.6%).
Passenger vessels reported proportionally more minor injuries, many of which involved passenger trips and falls while the vessel was underway.
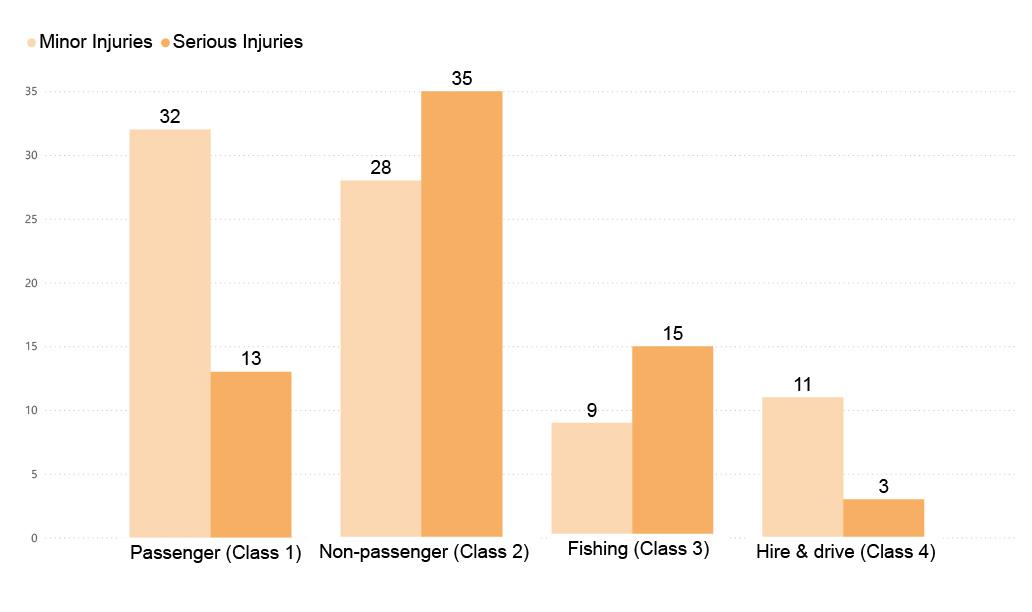
Figure 18 breaks down the circumstances under which these injuries occurred (noting that one incident may fall into multiple categories).
The most people were injured in incidents in the category vessel control and/or navigation at 27.3% of incidents. This category includes issues with the handling or loss of control of the vessel, issues with lookout and collision avoidance. In these incidents, people are often injured due to sudden movement of the vessel, contact with an object or collision with another vessel.
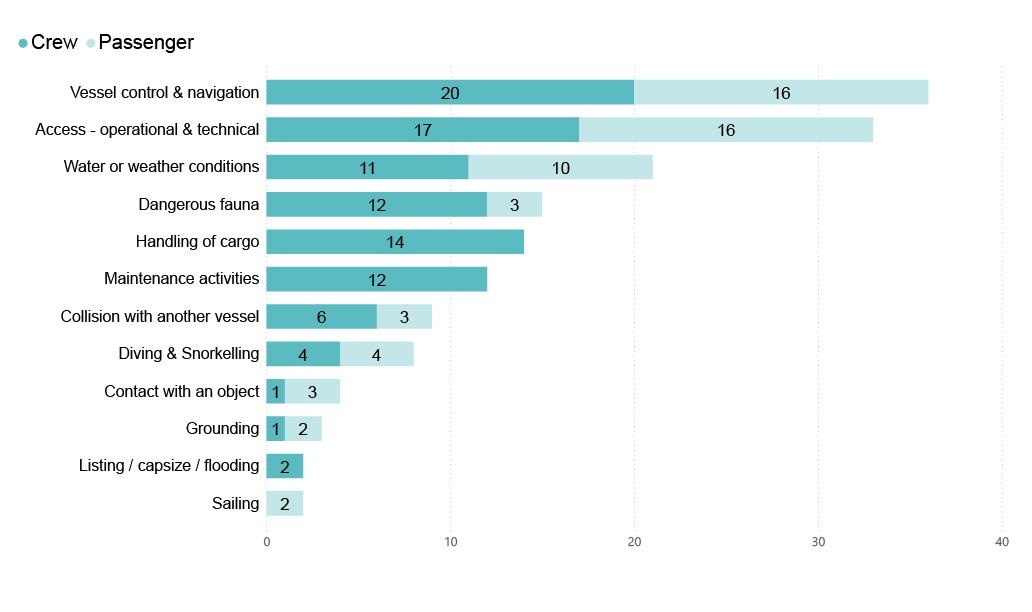
The second most common (22.6%) category resulting in injuries was related to vessel access. These injuries occurred around the vessel and included people losing balance, falling/tripping on stairs, slipping due to wet floors or railings and falling while getting on or off the vessel.
Working in poor weather conditions was identified as a contributing factor in 16.7% of the reported incidents in which people were injured.
Most of the dangerous fauna incidents (12 out of 15) involving crew injuries occurred while on Class 3 fishing vessels. Eight of these incidents occurred while working on board the vessel. The other three dangerous fauna incidents involved passenger injuries and occurred while snorkelling/diving. Two involved contact with whales and one with a jellyfish.
Footnotes
4 As a comparison the five-year average fatality rate (2015-2019) for the agriculture/forestry and fishing industry was 13.9 and for the transport/postal and warehousing industry it was 7.5. All other industries in the safe work report had a five-year average fatality rate of 3 or less. (Work-related traumatic injury fatalities, Australia, 2019. Safe Work Australia).
5 See Safe Work Australia Work-related, traumatic injuries fatalities 2019 Report.
6 Number of workers in Agriculture, forestry & fishing and Transport, postal & warehousing industries calculated from the number of fatalities and fatality rates per 100,000 workers in Safe Work Australia Work-related, traumatic injuries fatalities 2019 Report.
7 Based on a calculated approximation of 66,000 crew engaged on domestic commercial vessels
8 Mayhew, C. “Fatalities among fishing workers: does size matter?” Journal of Occupational Health Safety - Aust NZ, pp. 245-251, 2003.
9 Viauroux, C. and Gungor, A. “An Empirical Analysis of Life Jacket Effectiveness in Recreational Boating,” Risk Analysis, pp. 302-319, 2016.