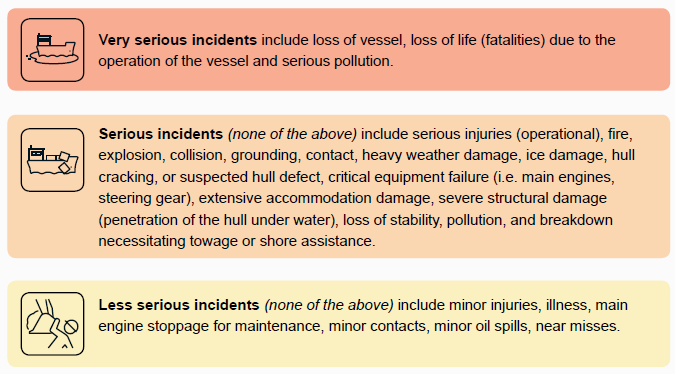
Marine incidents are classified by AMSA into one of three severity levels, as described below:
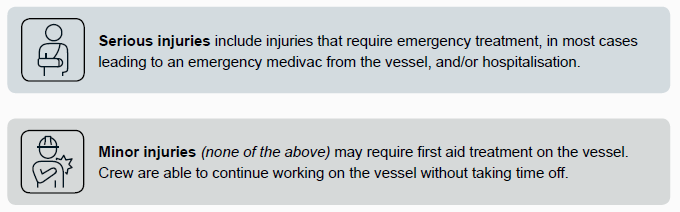
AMSA also classifies injuries into one of two categories as below:
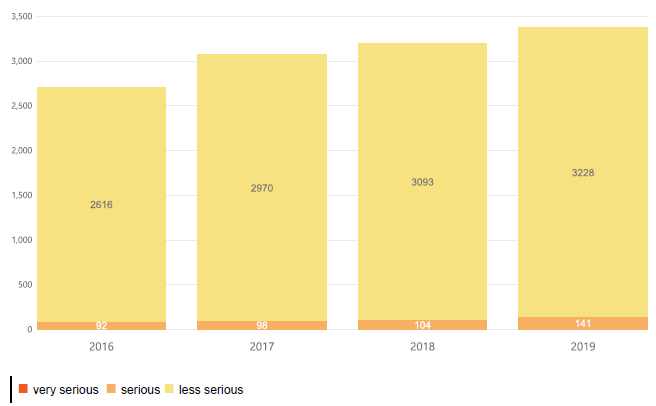
On average, 96.4% of incidents reported each year are less serious incidents. The number of very serious incidents has been stable over the last four years with a total of seven very serious incidents reported between the 2016 to 2019 period. One occurred in 2016 and two annually from 2017 through 2019.
In 2019, 0.06% of reported incidents were very serious (2), 4.2% serious (141) and 95.8% less serious (3228).
Reported incidents by vessel type
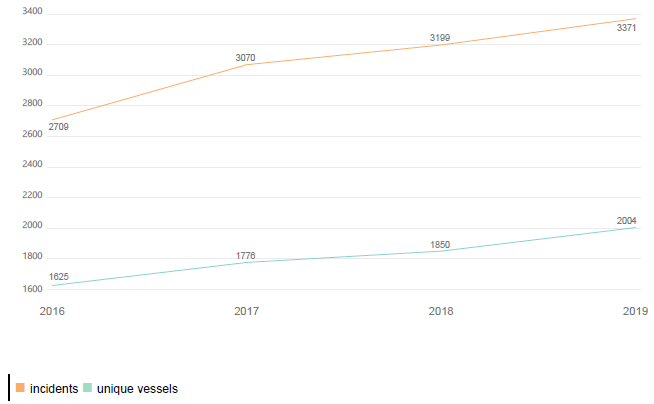
Between 2016 and 2019, 4909 unique vessels were associated with the 12,349 marine incident reports. This represents an average of 2.5 incidents reported per vessel over the four year period. Annually, the average of 1.7 incidents reported per vessel has remained consistent.
In 2019, 2004 unique vessels were involved in the 3371 marine incidents reported.
In 2019, the majority (54.5%) of incident reports came from bulk carriers followed by container vessels. This is consistent with previous years’ data.
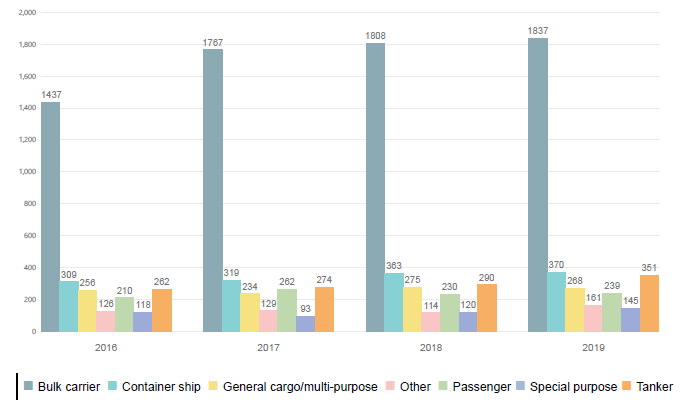
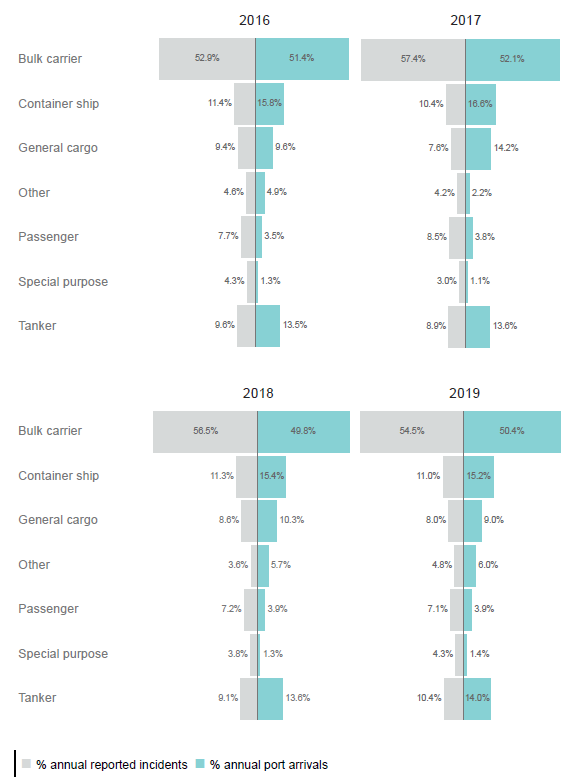
Figure 8 represents the annual percentage of reported incidents in relation to the percentage of port arrivals from 2016 to 2019. Although the results show consistency across the years in the proportion of reported incidents as related to the proportion of port arrivals, there are some minor differences. For example, between 2018 and 2019 the increase in the bulk carrier sector did not result in an increase in reporting.
In 2019, bulk carriers represented 55.4% of reported marine incidents and 50.4% of port arrivals. Although passenger vessels only represented 3.9% of port arrivals, they represented 7.1% of reported incidents. Similarly, special purpose vessels represented 1.4% of 2019 port arrivals but 4.3% of reported incidents.
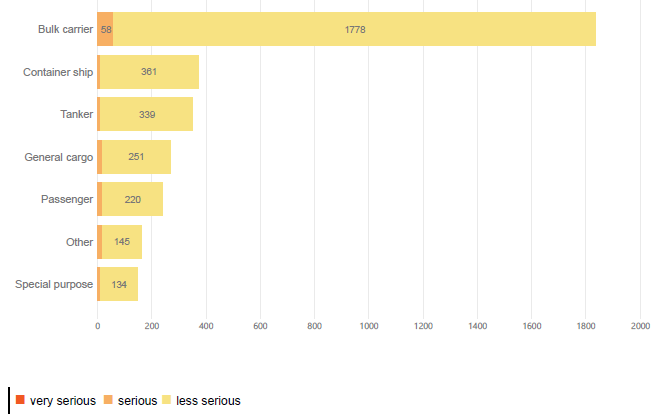
The proportion of very serious and serious incidents in relation to less serious incidents varies by the type of vessel. Although bulk carriers have the highest number of reported incidents, the rate of very serious and serious incidents is proportionally lower (3.2%) when compared to other vessel types. The ‘other’ vessel types (which include tugs, offshore service vessels and other) represent the highest proportion (9.9%) of very serious and serious incidents. This is followed by 7.9% for passenger vessels and 7.7 % for special purpose vessels.
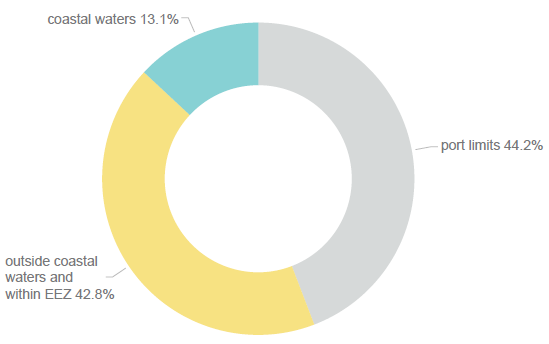
Reported incidents by location
Most incidents in 2019 occurred while the vessel was within port limits (44.2%) with a similar percentage (42.8%) occurring outside of coastal waters3 but within the limits of the exclusive economic zone (EEZ).
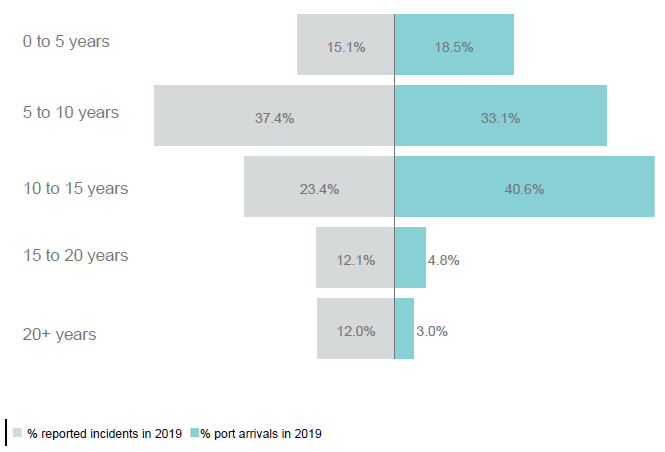
Reported incidents by age of vessel
In 2019, vessels more than 15 years old represented approximately 8% of port arrivals and 24% of reported incidents.
Footnote 3: Coastal waters incidents occur within 3 nautical miles offshore.