Risk rating
AMSA applies a dynamic risk profiling system to assist in allocating inspection resources in the most effective manner. The risk factor does not mean the ship is a high risk as such, it is simply a statistical tool to prioritise inspections. AMSA’s risk calculation uses multiple criteria to categorise ships into four priority groups, to calculate a risk factor for the ‘probability of detention’. Each group has a specific target inspection rate as shown below.
Table 17 – Target inspection rate
| Priority group | Risk factor (probability of detention) | Target inspection rate |
|---|---|---|
| Priority 1 | 6 or higher | 80% |
| Priority 2 | 4 or 5 | 40% |
| Priority 3 | 2 or 3 | 40% |
| Priority 4 | 0 or 1 | 20% |
The risk profile of ships visiting Australian ports shows an increase in unique arrivals of priority one, two and four ships and a slight decrease in the unique arrivals of priority three ships. Table 18 shows that AMSA achieved targeted inspection rates in all priority groups with an overall inspection rate of 39.8 per cent. This was achieved despite ongoing challenges of COVID-19 due to early implementation of precautionary measures to protect AMSA inspectors and ship's crew during inspections.
As shown in table 19 the risk profile has been successful in identifying priority 1 vessels as these have had higher detention and deficiency rates compared to other vessels inspected in 2021. The identification of lowest priority vessels, those in priority 4, was also successful as these vessels had a lower detention and deficiency rate compared to other vessels inspected in 2021.
There was some disparity in 2021 between priority 2 and priority 3 vessels and their related deficiency and detention rates, this disparity also occurred in 2016 and 2019. In response to these results AMSA has implemented a project to review and improve our targeting system aligning it with a dynamic risk-based approach that utilises modern data related to inspections, incidents and industry capability.
Table 18 – Unique foreign-flagged ships – by priority group
| Inspection priority | Ship arrivals | Eligible ships | Ships inspected | Inspection rate | ||||
| 2020 | 2021 | 2020 | 2021 | 2020 | 2021 | 2020 | 2021 | |
| Priority 1 | 613 | 634 | 379 | 414 | 334 | 351 | 84.1% | 84.8% |
| Priority 2 | 694 | 737 | 467 | 475 | 315 | 301 | 67.5% | 63.4% |
| Priority 3 | 2,152 | 2,140 | 1,777 | 1,731 | 850 | 771 | 47.8% | 44.5% |
| Priority 4 | 3,961 | 4,183 | 3,898 | 4,125 | 1,367 | 1,264 | 35.1% | 30.6% |
| Totals: | 7,420 | 7,694 | 6,539 | 6,745 | 2,866 | 2.687 | 43.8% | 39.8% |
Note: ship numbers may not match if a ship arrives multiple times over the year and the priority changes.
Table 19 – Detentions and deficiencies by ship Priority Group
| 2020 | 2021 | |||||
| Inspection Priority | Deficiencies | Deficiency rate | Detention rate | Deficiencies | Deficiency rate | Detention rate |
| Priority 1 | 1,236 | 3.3 | 9.3% | 1,198 | 3.0 | 7.6% |
| Priority 2 | 817 | 2.4 | 7.1% | 729 | 2.3 | 5.0% |
| Priority 3 | 1,915 | 2.1 | 5.9% | 2,054 | 2.5 | 7.1% |
| Priority 4 | 2,419 | 1.7 | 4.7% | 2,261 | 1.8 | 4.3% |
| Totals | 6,387 | 2.1 | 5.9% | 6,242 | 2.2 | 5.6% |
Figure 5 – Risk factor (RF) of arrivals – foreign-flagged ships
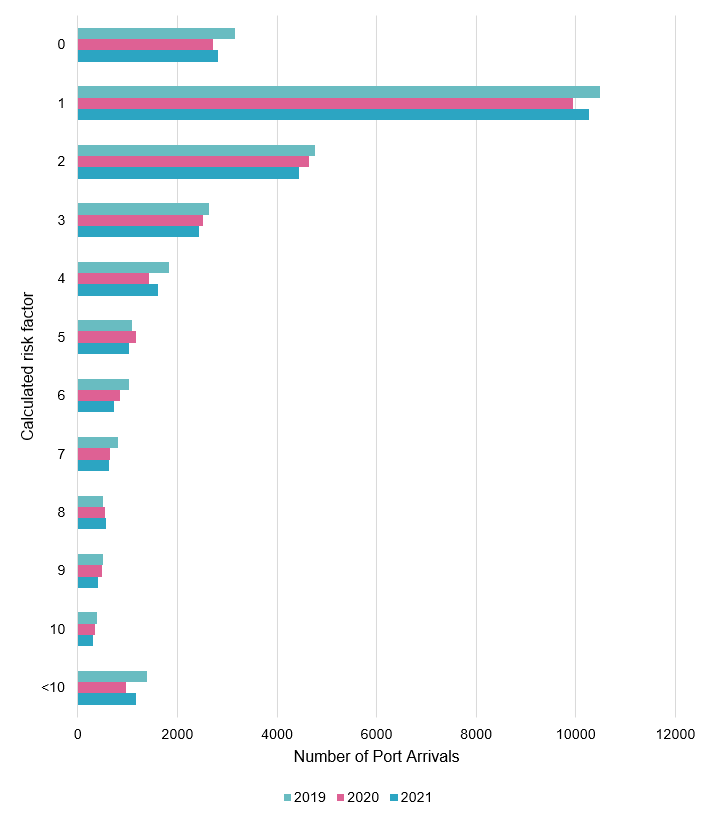
It is evident that the number of ships, of all risk factors, remained relatively consistent in 2021, compared with the results in 2020.