Arrivals
AMSA conducted PSC inspections at 53 out of the 74 ports visited by foreign ships across Australia in 2021. As shown in the table below, arrivals were not distributed evenly across the ports visited, with 42 per cent of all arrivals occurring at the top five ports.
Ship arrivals in Australian ports for 2021
| Total of 26,400 ship arrivals at Australian ports during 2021. | Arrivals – top five ports |
| 1. Port Hedland 3,238 (12.3%) | |
| 2. Newcastle 2,358 (8.9%) | |
| 3. Brisbane 2,207 (8.4%) | |
| 4. Gladstone 1,915 (7.3%) | |
| 5. Melbourne 1,790 (6.8%) |
Port Hedland remained the busiest port for foreign-flagged ship arrivals, predominantly for the export of iron ore. In Newcastle and Gladstone, most arrivals were for the dry bulk export of coal. In Brisbane and Melbourne, most arrivals were engaged in the container trade.
Figure 1 – 2021 Port arrivals by ship type
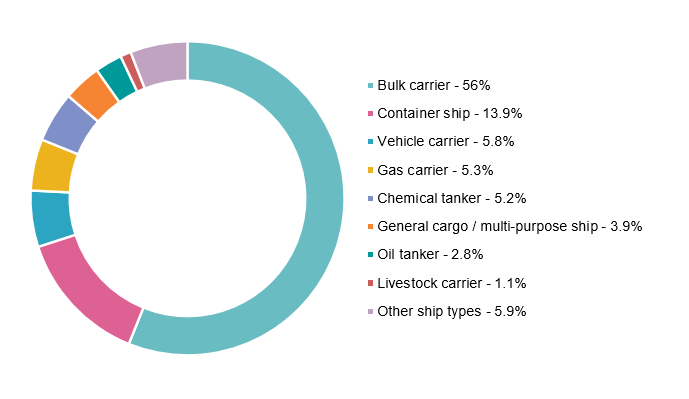
Table 2 – Ship arrivals by ship type in 2021 compared to 2020
| Ship type | 2020 | 2022 | Change |
| Bulk carrier | 14,355 | 14,814 | 3.2% |
| Chemical tanker | 1,555 | 1,370 | -11.9% |
| Container ship | 3,698 | 3,675 | -0.6% |
| Gas carrier | 1,474 | 1,406 | -4.6% |
| General cargo/ multi-purpose | 927 | 1,038 | 12.0% |
| Livestock carrier | 351 | 281 | -19.9% |
| Oil tanker | 757 | 733 | -3.2% |
| Vehicle carrier | 1,274 | 1,524 | 19.6% |
| Other | 1,847 | 1,559 | -15.6% |
| Total arrivals | 26,179 | 26,400 | 8.4% |
Inspections by ship type
In 2021, AMSA inspectors carried out 2,820 initial PSC inspections and 1,455 follow up inspections. AMSA inspectors are now able to conduct remote follow up inspections in accordance with Tokyo Memorandum of Understanding guidelines, 35 of the follow up inspections in 2021 were conducted remotely.
PSC inspections by ship type
| AMSA conducted 2820 PSC inspections in 2021. | 2021 top five ship types |
| 1. Bulk carrier – 1,712 (60.7%) | |
| 2. Container ships – 238 (8.4%) | |
| 3. Chemical tanker – 191 (6.8%) | |
| 4. General Cargo/multi-purpose – 156 (5.5%) | |
| 5. Oil tankers 124 – (4.4%) |
Table 3 – Total ships inspected by ship type
| Ship type | 2017 | 2018 | 2019 | 2020 | 2021 |
| Bulk carrier | 1,732 | 1,585 | 1,826 | 1,840 | 1,712 |
| Chemical tanker | 181 | 179 | 201 | 235 | 191 |
| Combination carrier | 1 | 0 | 0 | 1 | 4 |
| Commercial yacht | 1 | 0 | 0 | 0 | 1 |
| Container ship | 297 | 311 | 327 | 263 | 238 |
| Gas carrier | 52 | 53 | 77 | 55 | 24 |
| General cargo/ multi-purpose ship | 184 | 154 | 129 | 135 | 156 |
| Heavy load carrier | 19 | 30 | 40 | 36 | 27 |
| High speed passenger craft | 0 | 0 | 0 | 0 | 0 |
| Livestock carrier | 49 | 52 | 56 | 29 | 36 |
| MODU or FPSO | 2 | 0 | 0 | 0 | 0 |
| NLS tanker | 27 | 25 | 30 | 31 | 27 |
| Offshore service vessel | 17 | 19 | 12 | 15 | 10 |
| Oil tanker | 194 | 155 | 168 | 126 | 124 |
| Oil tanker/ chemical tanker | 0 | 0 | 0 | 2 | 16 |
| Oil Tanker/ NLS Tanker | 0 | 0 | 0 | 0 | 1 |
| Other types of ship | 29 | 14 | 21 | 18 | 26 |
| Passenger ship | 47 | 55 | 56 | 23 | 2 |
| Refrigerated cargo ship | 2 | 3 | 2 | 1 | 4 |
| Ro-ro cargo ship | 6 | 2 | 9 | 2 | 4 |
| Ro-ro passenger ship | 0 | 1 | 0 | 1 | 0 |
| Special purpose ship | 8 | 7 | 10 | 8 | 5 |
| Tugboat | 28 | 30 | 24 | 26 | 18 |
| Vehicle carrier | 180 | 181 | 172 | 122 | 129 |
| Wood-chip carrier | 72 | 66 | 62 | 52 | 65 |
| Totals | 3,128 | 2,922 | 3,222 | 3,021 | 2,820 |
Table 3 shows the number of inspections by ship type from 2017 to 2021.
Inspection by location
Of the 53 ports where inspections were conducted, the top five ports accounted for 43.6% per cent of the 2,820 initial PSC inspections undertaken as shown in Table 4.
Table 4 – PSC inspections 2021 top 15 locations
| 2017 | 2018 | 2019 | 2020 | 2021 | % of total in 2021 | |
| Port Hedland | 311 | 441 | 694 | 497 | 536 | 19.0% |
| Fremantle | 416 | 410 | 382 | 312 | 280 | 9.9% |
| Brisbane | 278 | 238 | 249 | 248 | 249 | 8.8% |
| Sydney | 205 | 190 | 282 | 249 | 174 | 6.2% |
| Gladstone | 206 | 181 | 147 | 214 | 164 | 5.8% |
| Newcastle | 316 | 212 | 207 | 235 | 163 | 5.8% |
| Dampier | 187 | 156 | 159 | 175 | 155 | 5.5% |
| Port Adelaide | 88 | 99 | 56 | 109 | 132 | 4.7% |
| Melbourne | 156 | 156 | 151 | 104 | 130 | 4.6% |
| Hay Point | 180 | 155 | 184 | 157 | 124 | 4.4% |
| Geraldton | 94 | 83 | 100 | 74 | 90 | 3.2% |
| Bunbury | 32 | 33 | 31 | 58 | 87 | 3.1% |
| Port Kembla | 83 | 49 | 43 | 62 | 74 | 2.6% |
| Townsville | 100 | 81 | 75 | 75 | 63 | 2.2% |
| Port Walcott | 96 | 110 | 137 | 58 | 45 | 1.6% |
| Bell Bay | 43 | 41 | 40 | 35 | 45 | 1.6% |
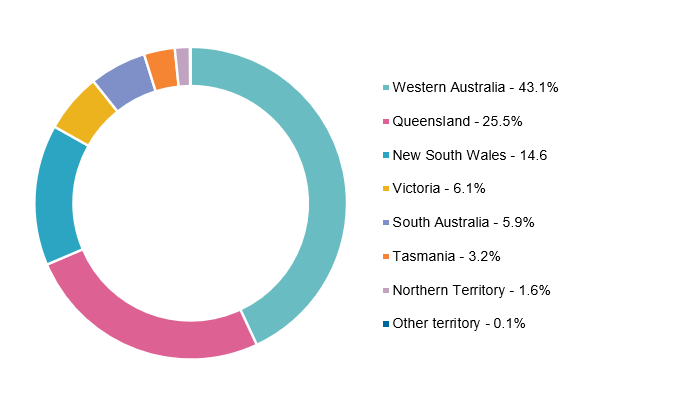
As in previous years, in 2021 the greatest numbers of PSC initial inspections were undertaken in Western Australia, followed by Queensland and New South Wales. Inspections by state are shown in Table 5.
Table 5 – PSC inspections in 2021 by state/territory
| State/territory | PSC inspections |
| Western Australia | 1214 |
| Queensland | 720 |
| New South Wales | 411 |
| Victoria | 173 |
| South Australia | 166 |
| Tasmania | 90 |
| Northern Territory | 44 |
| Other Territory (Christmas Island, Cocos Keeling) | 2 |
| Total | 2820 |
Figure 2 – PSC inspections in 2021 by state/territory
Inspections by flag State
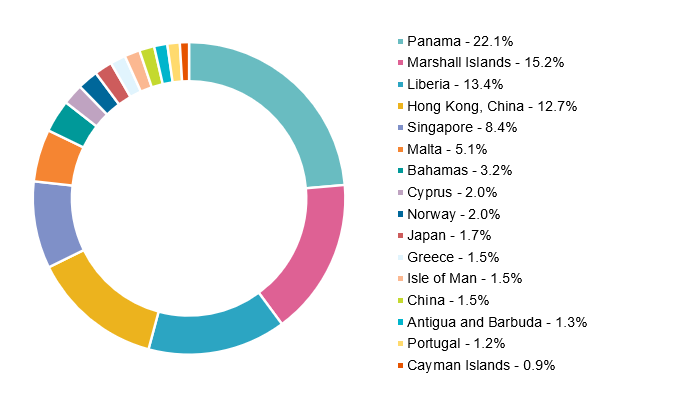
In 2021, Panama remained the flag State with the largest number of ships inspected by AMSA, with 624 Panamanian ships (22 per cent of the total) being subject to an initial PSC inspection.
The top five flag States remains unchanged since 2015 and inspections of ships from Panama, Liberia, Marshall Islands, Hong Kong China and Singapore accounted for 72 per cent of all PSC inspections in 2021. The top 12 flags, as listed in Table 6, accounted for 2,505 inspections, or 89 per cent of all inspections.
A five-year breakdown of the number of ships inspected by flag State is provided in Table 7. The table does not show any significant change in the proportional inspection rates by flag States over the last five years.
Table 6 – PSC inspections by top 12 flag States in 2021
| Top 12 flag States | 2017 | 2018 | 2019 | 2020 | 2021 |
| PANAMA | 763 | 622 | 678 | 703 | 624 |
| MARSHALL ISLANDS | 337 | 377 | 405 | 397 | 429 |
| LIBERIA | 304 | 340 | 401 | 399 | 378 |
| HONG KONG, CHINA | 311 | 306 | 399 | 330 | 358 |
| SINGAPORE | 326 | 292 | 289 | 295 | 238 |
| MALTA | 210 | 186 | 191 | 184 | 143 |
| BAHAMAS | 121 | 97 | 119 | 114 | 89 |
| CYPRUS | 73 | 63 | 66 | 54 | 57 |
| NORWAY | 55 | 53 | 70 | 55 | 56 |
| JAPAN | 60 | 54 | 58 | 66 | 49 |
| GREECE | 49 | 60 | 63 | 47 | 42 |
| ISLE OF MAN | 52 | 54 | 54 | 40 | 42 |
Note: figures in bold are not in the top 12 in those years.
Table 7 – Total ships inspected by flag State
| Flag State | 2017 | 2018 | 2019 | 2020 | 2021 |
| ANTIGUA & BARBUDA | 44 | 31 | 30 | 37 | 36 |
| BAHAMAS | 121 | 98 | 119 | 114 | 89 |
| BANGLADESH | 0 | 0 | 0 | 0 | 1 |
| BARBADOS | 3 | 5 | 1 | 2 | 1 |
| BELGIUM | 3 | 8 | 3 | 12 | 3 |
| BELIZE | 0 | 1 | 0 | 0 | 0 |
| BERMUDA | 15 | 11 | 17 | 7 | 3 |
| BRUNEI DARUSSALAM | 1 | 1 | 0 | 0 | 0 |
| CAYMAN ISLANDS | 34 | 32 | 29 | 29 | 25 |
| CHINA | 53 | 46 | 63 | 36 | 41 |
| COMOROS | 1 | 0 | 0 | 0 | 0 |
| COOK ISLANDS | 7 | 5 | 5 | 8 | 9 |
| CROATIA | 5 | 3 | 0 | 1 | 1 |
| CYPRUS | 73 | 63 | 66 | 54 | 57 |
| DENMARK | 16 | 12 | 24 | 12 | 10 |
| DOMINICA | 0 | 0 | 1 | 0 | 0 |
| EGYPT | 0 | 1 | 0 | 0 | 0 |
| FIJI | 4 | 2 | 0 | 0 | 0 |
| FRANCE | 8 | 3 | 8 | 3 | 0 |
| GERMANY | 9 | 6 | 4 | 1 | 3 |
| GIBRALTAR | 4 | 7 | 2 | 2 | 3 |
| GREECE | 49 | 60 | 63 | 47 | 42 |
| HONG KONG, CHINA | 312 | 306 | 399 | 330 | 358 |
| INDIA | 9 | 11 | 6 | 5 | 7 |
| INDONESIA | 0 | 2 | 0 | 0 | 1 |
| IRAN (ISLAMIC REPUBLIC OF) | 1 | 0 | 0 | 0 | 0 |
| ISLE OF MAN | 52 | 54 | 54 | 40 | 42 |
| ITALY | 16 | 21 | 24 | 20 | 9 |
| JAMAICA | 0 | 0 | 2 | 0 | 1 |
| JAPAN | 60 | 55 | 58 | 66 | 49 |
| KOREA (THE REPUBLIC OF) | 48 | 36 | 37 | 27 | 23 |
| KUWAIT | 4 | 4 | 4 | 3 | 3 |
| LIBERIA | 304 | 340 | 401 | 399 | 378 |
| LIBYA | 0 | 1 | 2 | 0 | 1 |
| LUXEMBOURG | 7 | 5 | 16 | 5 | 8 |
| MALAYSIA | 8 | 10 | 12 | 8 | 6 |
| MALTA | 210 | 186 | 191 | 184 | 143 |
| MARSHALL ISLANDS | 337 | 377 | 405 | 397 | 429 |
| MONTENEGRO | 0 | 0 | 0 | 0 | 1 |
| NETHERLANDS | 20 | 18 | 22 | 23 | 14 |
| NEW ZEALAND | 3 | 3 | 2 | 1 | 2 |
| NORWAY | 55 | 52 | 70 | 55 | 56 |
| PAKISTAN | 1 | 0 | 0 | 1 | 0 |
| PANAMA | 761 | 621 | 678 | 703 | 624 |
| PAPUA NEW GUINEA | 7 | 4 | 0 | 1 | 0 |
| PHILIPPINES | 19 | 23 | 11 | 9 | 7 |
| PORTUGAL | 31 | 43 | 42 | 35 | 34 |
| QATAR | 0 | 2 | 0 | 5 | 3 |
| RUSSIAN FEDERATION | 0 | 0 | 1 | 0 | 0 |
| SAINT VINCENT AND THE GRENADINES | 4 | 2 | 0 | 0 | 1 |
| SAMOA | 0 | 0 | 0 | 0 | 1 |
| SAUDI ARABIA | 1 | 0 | 2 | 0 | 0 |
| SINGAPORE | 328 | 292 | 289 | 295 | 238 |
| SOUTH AFRICA | 0 | 0 | 0 | 0 | 1 |
| SPAIN | 0 | 1 | 2 | 1 | 0 |
| SRI LANKA | 1 | 0 | 1 | 0 | 1 |
| SWEDEN | 10 | 7 | 7 | 2 | 6 |
| SWITZERLAND | 7 | 5 | 1 | 1 | 1 |
| TAIWAN (PROVINCE OF CHINA) | 7 | 4 | 9 | 10 | 10 |
| TANZANIA (UNITED REPUBLIC OF) | 1 | 0 | 0 | 0 | 0 |
| THAILAND | 9 | 9 | 6 | 6 | 10 |
| TURKEY | 3 | 1 | 3 | 1 | 2 |
| TUVALU | 1 | 0 | 1 | 2 | 1 |
| UNITED KINGDOM | 28 | 23 | 22 | 18 | 16 |
| UNITED STATES OF AMERICA | 5 | 2 | 2 | 0 | 2 |
| VANUATU | 7 | 5 | 4 | 3 | 5 |
| VIETNAM | 1 | 2 | 0 | 0 | 2 |
| Total: | 3128 | 2922 | 3222 | 3021 | 2820 |
Figure 3 represents inspections by flag State where 25 or more ships have been subjected to inspection during 2021. Flag States that have less than 25 inspections in a year are not considered to be statistically significant in this context.
Figure 3 – Distribution of PSC inspections by flag State