AMSA continues to use a dynamic risk profiling system to assist in allocating inspection resources in the most effective manner. The risk factor does not mean the ship is a high risk as such, it is simply a statistical tool to prioritise inspections. AMSA’s risk calculation uses multiple criteria to categorise ships into four priority groups, to calculate a risk factor for the ‘probability of detention’. Each group has a specific target inspection rate as shown below.
Table 17—Target inspection rate
| Priority group | Risk factor (probability of detention) | Target inspection rate |
|---|---|---|
| Priority 1 | 6 or higher | 80% |
| Priority 2 | 4 or 5 | 60% |
| Priority 3 | 2 or 3 | 40% |
| Priority 4 | 0 or 1 | 20% |
The risk profile of ships visiting Australian ports shows an increase in unique arrivals of priority two, three and four ships and a decrease in the unique arrivals of priority one ships. Table 18 shows that AMSA achieved targeted inspection rates in all priority groups with an overall inspection rate of 43.8 per cent. This was achieved despite the challenges of COVID-19 due to early implementation of precautionary measures to protect AMSA inspectors and ship's crew during inspections.
Table 18 shows the number of inspections where no deficiencies were recorded. The data for 2020 indicates that 48.1 per cent of all inspections (1453 out of 3021 PSC inspections) resulted in no deficiencies being issued.
The fact that risk factor is not representative of the level of risk posed by all ships in a particular group is reflected in the proportion of ships in P1 and P2 where no deficiencies were identified.
Table 18—Unique foreign-flagged ships – by priority group
| Inspection priority | Ship arrivals | Eligible ships | Ships inspected | Inspection rate | Inspections with no deficiencies | |||||
|---|---|---|---|---|---|---|---|---|---|---|
| 2019 | 2020 | 2019 | 2020 | 2019 | 2020 | 2019 | 2020 | 2019 | 2020 | |
| Priority 1 | 631 | 613 | 431 | 397 | 393 | 334 | 91.4% | 84.1% | 194 39.7% | 152 40.2% |
| Priority 2 | 660 | 694 | 453 | 467 | 329 | 315 | 72.6% | 67.5% | 164 46.1% | 134 39.4% |
| Priority 3 | 2022 | 2,152 | 1686 | 1777 | 845 | 850 | 50.1% | 47.8% | 467 51.4% | 404 45.1% |
| Priority 4 | 3939 | 3,961 | 3883 | 3898 | 1366 | 1367 | 35.2% | 35.1% | 907 61.8% | 763 54.2% |
| Totals: | 7252 | 7,420 | 6453 | 6,539 | 2933 | 2,866 | 45.5% | 43.8% | 1732 53.8% | 1453 48.1% |
Note: ship numbers may not match if a ship arrives multiple times over the year and the priority changes.
Number of deficiencies by ship Priority Group
| 2019 | 2020 | |||
|---|---|---|---|---|
| Priority group | Deficiencies | Deficiencies per inspection | Deficiencies | Deficiencies per inspection |
| Priority 1 | 1285 | 2.6 | 1236 | 3.3 |
| Priority 2 | 704 | 2.0 | 817 | 2.4 |
| Priority 3 | 1580 | 1.7 | 1915 | 2.1 |
| Priority 4 | 1712 | 1.2 | 2419 | 1.7 |
| Totals | 5281 | 1.6 | 6387 | 2.1 |
Figure 5 – Risk factor (RF) of arrivals – foreign-flagged ships
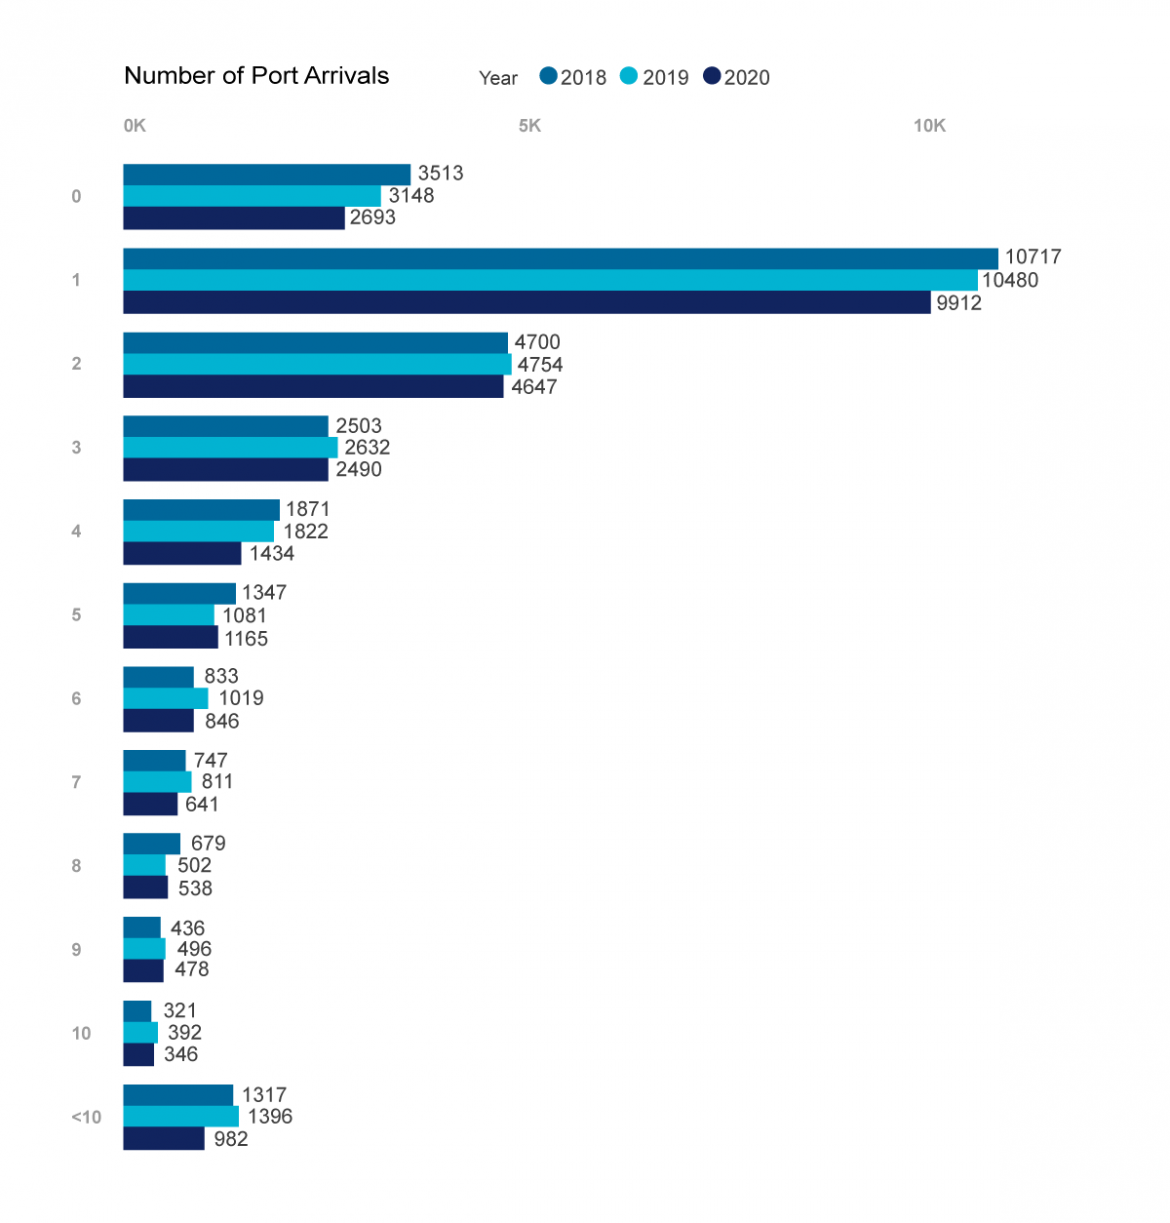
It is evident that the number of ships, of all risk factors, remained relatively consistent in 2020, compared with the results in 2019.