The IMO defines a detention as: ‘intervention action taken by the port State when the condition of the ship or its crew does not correspond substantially with the applicable conventions to ensure that the ship will not sail until it can proceed to sea without presenting a danger to the ship or persons on board, or without presenting an unreasonable threat of harm to the marine environment, whether or not such action will affect the scheduled departure of the ship’.
Detainable deficiencies by category
Table 11 shows the proportion of detainable deficiencies in different categories over a three- year period. As indicated in the table, the detainable deficiencies relating to the category of ISM increased in 2020, while the categories of fire safety, emergency systems, lifesaving appliances and water/weather-tight conditions round out the top five categories of detainable deficiencies. The proportion of MLC related detentions dropped to seventh place (previously in sixth place since 2014) but remains significant. AMSA exercised flexibility and worked with industry in its dealings with MLC related deficiencies during the height of the COVID-19 pandemic. Flexibility and proactive work with industry, specifically around seafarer repatriation prevented a significant surge in detainable deficiencies relating to MLC.
The relatively high proportion of detainable deficiencies attributed to the ISM category suggests that safety management systems (SMS) are not properly and effectively implemented onboard as was intended. While the proportion may be considered to be a cause of concern history provides context. In 2013, the number of ISM detainable deficiencies peaked at 120 (31.2 per cent share of detainable deficiencies), this number was 76 (28.1 per cent share of detainable deficiencies) in 2020.
Shipboard operations and maintenance were again the highest contributors to ISM detentions, followed by emergency preparedness. The implementation of SMS procedures relating to safety of navigation continued to make a relatively high contribution to shipboard operations ISM detentions in 2020.
Table 11—Detainable deficiencies by category
| Category | 2018 number of deficiencies | 2018 Share % | 2019 number of deficiencies | 2019 Share % | 2020 number of deficiencies | 2020 Share % |
|---|---|---|---|---|---|---|
| ISM | 49 | 21.1% | 52 | 23.9% | 76 | 28.1% |
| Fire safety | 38 | 16.4% | 38 | 17.4% | 37 | 13.7% |
| Lifesaving appliances | 26 | 11.2% | 32 | 14.7% | 37 | 13.7% |
| Emergency systems | 29 | 12.5% | 36 | 16.5% | 35 | 13.0% |
| Water/weather-tight conditions | 12 | 5.2% | 9 | 4.1% | 22 | 8.1% |
| Pollution prevention | 28 | 12.0% | 25 | 11.5% | 21 | 7.8% |
| Labour conditions | 21 | 9.1% | 15 | 6.9% | 19 | 7.0% |
| Other | 12 | 5.2% | 0 | 0.0% | 9 | 3.3% |
| Cargo operations including equipment | 0 | 0.0% | 0 | 0.0% | 5 | 1.9% |
| Certificates and documentation | 0 | 1.3% | 3 | 1.4% | 3 | 1.1% |
| Structural conditions | 2 | 0.9% | 0 | 0.0% | 2 | 0.7% |
| Alarms | 1 | 0.4% | 0 | 0.0% | 2 | 0.7% |
| Radio communications | 2 | 0.9% | 4 | 1.8% | 1 | 0.4% |
| Propulsion and auxiliary machinery | 0 | 2.2% | 0 | 0.0% | 1 | 0.4% |
| Safety of navigation | 3 | 1.3% | 4 | 1.8% | 0 | 0.0% |
| Dangerous goods | 0 | 0.0% | 0 | 0.0% | 0 | 0.0% |
| International Ship and Port Facility Security Code (ISPS) | 0 | 0.0% | 0 | 0.0% | 0 | 0.0% |
Detentions by ship type
In 2020 AMSA detained 178 ships with an average detention rate of 5.9 per cent compared to 163 ships detained in 2019 with an average detention rate of 5.1 per cent.
Table 12—Top five detention rates by ship type in 2019 and 2020
| AMSA detained 178 ships in 2020, with an average detention rate of 5.9%. | 2019 – 5.1% average (number of detentions) | 2020 – 5.9% average (number of detentions) |
| Offshore service vessel – 16.7% (2) | General cargo/multi-purpose ship –– 10.4% (14) | |
| Heavy load carrier – 10% (4) | Heavy load carrier – 8.3% (3) | |
| General cargo/multi-purpose ship – 7.8% (10) | Livestock carrier – 6.9% (2) | |
| Container ship – 6.7% (22) | Bulk carrier – 6.6% (121) | |
| Bulk carrier – 5.9% (107) | Container ship – 6.5% (17) |
Note: only ship types with 10 or more inspections are included.
The poorest performing ship type was general cargo ships, followed by heavy load carriers and livestock carriers. General cargo ships have been in the top five poorest performing ship types for the past seven years while container ships have been in the top five for the past three years.
Bulk carriers represented the largest number of PSC detentions, as shown in Table 13. This is expected given the significant proportion of bulk carrier arrivals and the number of ships eligible to be inspected4. The bulk carrier detention rate increased to 6.6 per cent, above the 5.9 per cent average for all ships in 2020. This is a continuing trend as bulk carriers have exceeded the average detention rate for the last five years and are the fourth worst performing ship type in 2020.
Table 13—Detentions by ship type
| Category | 2020 | 2019 | ||
|---|---|---|---|---|
| Ship type | Inspections | Detentions | Detention rate | Detention rate |
| Bulk carrier | 1,840 | 121 | 6.6% | 5.9% |
| Chemical tanker | 235 | 7 | 3.0% | 3.5% |
| Combination carrier | 1* | 0 | 0.0% | 0.0% |
| Container ship | 263 | 17 | 6.5% | 6.7% |
| Gas carrier | 55 | 2 | 3.6% | 1.3% |
| General cargo/multi-purpose ship | 135 | 14 | 10.4% | 7.8% |
| Heavy load carrier | 36 | 3 | 8.3% | 10.0% |
| Livestock carrier | 29 | 2 | 6.9% | 3.6% |
| NLS tanker | 31 | 1 | 3.2% | 3.3% |
| Offshore service vessel | 15 | 0 | 0.0% | 16.7% |
| Oil tanker | 126 | 4 | 3.2% | 0.6% |
| Oil tanker/chemical tanker | 2* | 0 | 0.0% | 0.0% |
| Other types of ship | 18 | 0 | 0.0% | 0.0% |
| Passenger ship | 23 | 1 | 4.3% | 0.0% |
| Refrigerated cargo ship | 1* | 0 | 0.0% | 0.0% |
| Ro-ro cargo ship | 2* | 0 | 0.0% | 0.0% |
| Ro-ro passenger ship | 1* | 0 | 0.0% | 0.0% |
| Special purpose ship | 8* | 0 | 0.0% | 0.0% |
| Tugboat | 26 | 0 | 0.0% | 0.0% |
| Vehicle carrier | 122 | 4 | 3.3% | 2.9% |
| Wood-chip carrier | 52 | 2 | 3.8% | 1.6% |
| Totals | 3021 | 178 | 5.9% | 5.1% |
* As there are less than 10 inspections of this ship type these are not counted in the performance assessment.
The following is notable with regard to detention by ship type in 2020:
- 1840 bulk carriers were inspected with 4105 deficiencies issued resulting in 121 detentions. The detention rate for bulk carriers increased to 6.6 per cent from 5.9 per cent in 2019.
- Offshore service vessels had zero detentions from 15 inspections compared to two detentions from 12 inspections in 2019.
- Tugboats had zero detentions from 26 inspections.
- General cargo ships had the highest detention rate at 10.4 per cent, a 2.6 per cent increase compared to 2019.
- Oil tankers had a detention rate of 3.2 per cent, a 2.6 per cent increase compared to 2019, but still well below the 2020 average of 5.9 per cent.
- Heavy load carriers had the second highest detention rate at 8.3 per cent, a 1.7 per cent decrease compared to 2019.
- General cargo ships and heavy load carriers had the top two highest detention rates in both 2019 and 2020.
Detentions by flag State
Individual flag State performance can be determined by comparing the percentage share of the number of inspections against the percentage share of the number of detentions for each flag State. Where the percentage share of detentions is higher than the percentage share of inspections, this is an indication that the ships of that flag State are performing below average. This is represented in Figure 4.
Top five detention rates by flag State 2020
There was a total of 178 foreign-flag ships detained in 2020. The average detention rate for all ships was 5.9%. | Flag State (Detention Rate %) |
| 1. Denmark – 16.7% | |
| 2. Antigua and Barbuda – 10.8% | |
| 3. Taiwan (Province of China) – 10.0% | |
| 4. Norway – 9.1% | |
| 5. Netherlands – 8.7% |
Note: this table only covers ship types with 10 or more inspections.
Figure 4 – Share of detentions compared to share of inspections
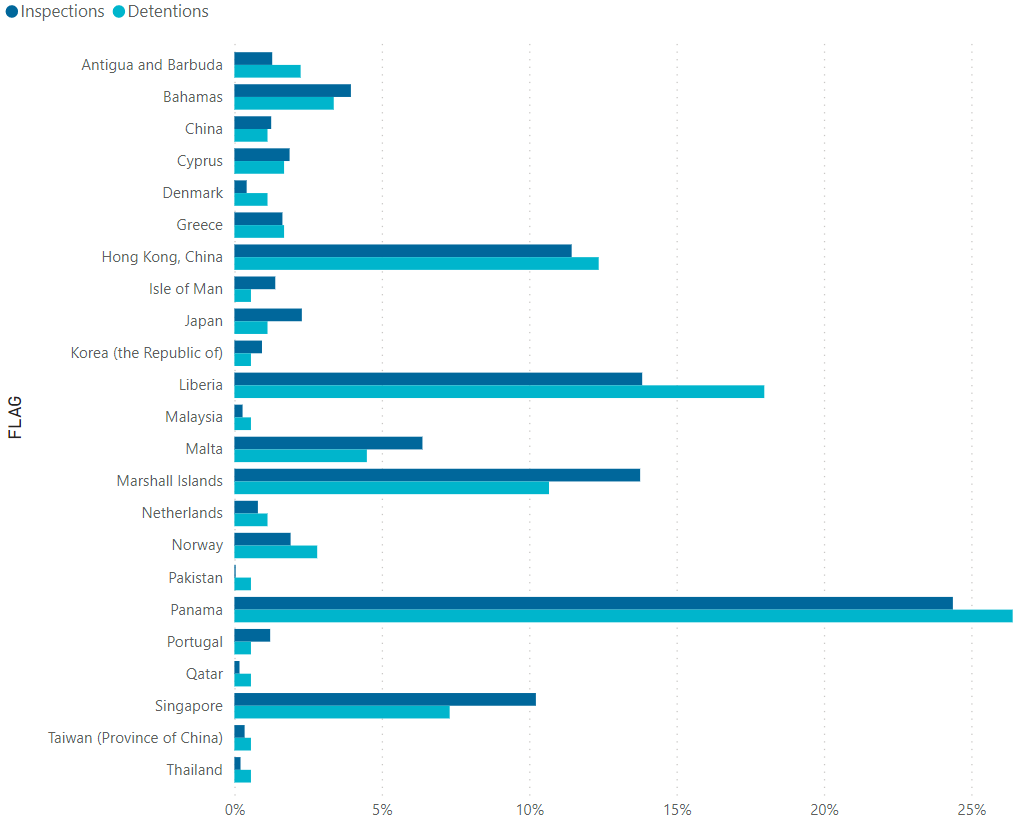
Note: a detailed breakdown of this graph can be found in the Appendix.
Where a flag State is subject to a small number of inspections, a single detention can result in the flag State exceeding the average detention rate, as shown in Table 15. This may not be an accurate measure of performance. A more accurate assessment of performance of individual flag States can be drawn by comparing detention rates over three years, as shown in Table 14. This table shows that Antigua and Barbuda, Liberia and Panama have all exceeded the overall average detention rate over the three years from 2018 to 2020.
Table 14—Flag States that exceeded the average in 2018, 2019 and 2020 (note this only covers flag States with 10 or more inspections each year)
| 2018 (average 5.5%) | 2019 (average 5.1%) | 2020 (average 5.9%) | |||
|---|---|---|---|---|---|
| Flag State | Detention rate (number) | Flag State | Detention rate (number) | Flag State | Detention rate (number) |
| India | 18.2% (2) | Antigua and Barbuda | 13.3% (4) | Denmark | 16.7% (2) |
| Antigua and Barbuda | 16.1% (5) | Cayman Islands | 10.3% (3) | Antigua and Barbuda | 10.8% (4) |
| Italy | 14.3% (3) | Cyprus | 9.1% (6) | Taiwan (Province of China) | 10.0% (1) |
| Philippines | 13.0% (3) | Philippines | 9.1% (1) | Norway | 9.1% (5) |
| Portugal | 9.8% (4) | Denmark | 8.3% (2) | Netherlands | 8.7% (2) |
| Liberia | 9.4% (32) | Malaysia | 8.3% (1) | Liberia | 8.0% (32) |
| Cyprus | 7.9% (5) | Liberia | 6.7% (27) | Panama | 6.7% (47) |
| Japan | 7.4% (4) | Greece | 6.3% (4) | Hong Kong, China | 6.7% (22) |
| Hong Kong, China | 6.5% (20) | Panama | 6.3% (43) | Greece | 6.4% (3) |
| Panama | 5.9% (37) | Luxembourg | 6.3% (1) | ||
| Netherlands | 5.6% (1) | Malta | 5.8% (11) | ||
| Republic of Korea | 5.6% (2) | Isle of Man | 5.6% (3) | ||
| Portugal | 5.3% (2) | ||||
Bold text=Exceeded the average detention rate in two years out of three
Italics=Exceeded the average detention rate in three years out of three
Table 15—Inspections and detentions by flag State
| Flag State | Inspections | Detentions | Detention rate |
|---|---|---|---|
| ANTIGUA AND BARBUDA | 37 | 4 | 10.8% |
| BAHAMAS | 114 | 6 | 5.3% |
| BARBADOS | 2 | 0 | 0.0% |
| BELGIUM | 12 | 0 | 0.0% |
| BERMUDA | 7 | 0 | 0.0% |
| CAYMAN ISLANDS | 29 | 0 | 0.0% |
| CHINA | 36 | 2 | 5.6% |
| COOK ISLANDS | 8 | 0 | 0.0% |
| CROATIA | 1 | 0 | 0.0% |
| CYPRUS | 54 | 3 | 5.6% |
| DENMARK | 12 | 2 | 16.7% |
| FRANCE | 3 | 0 | 0.0% |
| GERMANY | 1 | 0 | 0.0% |
| GIBRALTAR | 2 | 0 | 0.0% |
| GREECE | 47 | 3 | 6.4% |
| HONG KONG, CHINA | 330 | 22 | 6.7% |
| INDIA | 5 | 0 | 0.0% |
| ISLE OF MAN | 40 | 1 | 2.5% |
| ITALY | 20 | 0 | 0.0% |
| JAPAN | 66 | 2 | 3.0% |
| KOREA (THE REPUBLIC OF) | 27 | 1 | 3.7% |
| KUWAIT | 3 | 0 | 0.0% |
| LIBERIA | 399 | 32 | 8.0% |
| LUXEMBOURG | 5 | 0 | 0.0% |
| MALAYSIA | 8 | 1 | 12.5% |
| MALTA | 184 | 8 | 4.3% |
| MARSHALL ISLANDS | 397 | 19 | 4.8% |
| NETHERLANDS | 23 | 2 | 8.7% |
| NEW ZEALAND | 1 | 0 | 0.0% |
| NORWAY | 55 | 5 | 9.1% |
| PAKISTAN | 1 | 1 | 100.0% |
| PANAMA | 703 | 47 | 6.7% |
| PAPUA NEW GUINEA | 1 | 0 | 0.0% |
| PHILIPPINES | 9 | 0 | 0.0% |
| PORTUGAL | 35 | 1 | 2.9% |
| QATAR | 5 | 1 | 20.0% |
| SINGAPORE | 295 | 13 | 4.4% |
| SPAIN | 1 | 0 | 0.0% |
| SWEDEN | 2 | 0 | 0.0% |
| SWITZERLAND | 1 | 0 | 0.0% |
| TAIWAN (PROVINCE OF CHINA) | 10 | 1 | 10.0% |
| THAILAND | 6 | 1 | 16.7% |
| TURKEY | 1 | 0 | 0.0% |
| TUVALU | 2 | 0 | 0.0% |
| UNITED KINGDOM | 18 | 0 | 0.0% |
| VANUATU | 3 | 0 | 0.0% |
| Total: | 3021 | 178 | 5.9% |
Note: flag States above the average detention rate with more than 10 inspections are provided in bold.
![]() Footnote:
Footnote:
4. All foreign flag ships are eligible for inspection six months from a previous inspection by AMSA or on their first arrival at an Australian port.