MLC complaints received
The MLC requires all vessels to have an onboard complaints procedure that provides seafarers with the opportunity to make complaints without concern or repercussion. The MLC also has provisions which gives rights to seafarers to make a complaint to the relevant flag or port State authorities when they believe that their living and/or working conditions on board are below standard.
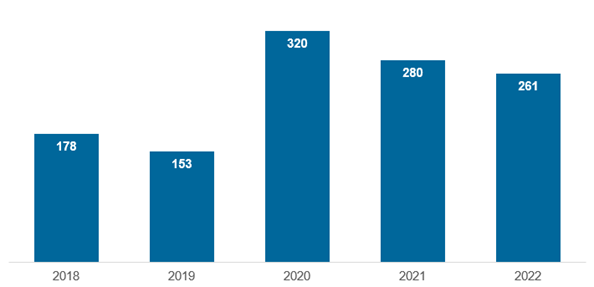
In 2022, AMSA received 261 complaints3 representing a 6.8 per cent decrease on the number received in 2021 (280) which has continued to decline from the peak of 320 complaints received in 2020. The reduced frequency of complaints is indicative of industry and operators continued adjustment following the COVID-19 pandemic peak, but is still higher than pre-Covid levels.
Follow up to complaints received
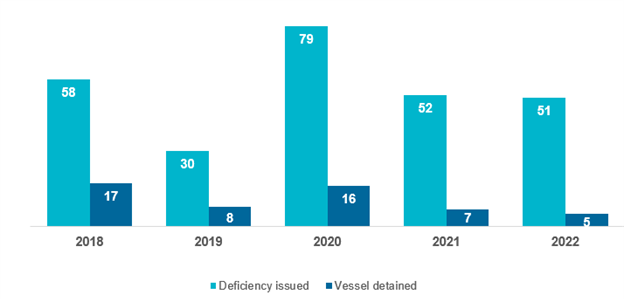
When complaints are received by AMSA, all necessary actions are taken to ensure the confidentiality of the seafarer making the complaint. Where appropriate, AMSA encourages resolution of complaints at shipboard level, and if this is not possible, at the flag State level. If a complaint can’t be resolved, AMSA will follow-up and may issue deficiencies or detain vessels.
AMSA has a zero-tolerance approach to breaches under the MLC and has issued refusal of access direction notices to vessels from Australian ports for systemic non-compliance with the MLC (Refusal of access list and letters of warning list). Vessels that are not operated and managed to meet applicable standards, and relevant Australian laws, pose an increased risk to seafarers, other vessels and the marine environment. Since 2018, a total of 16 vessels have been issued with a direction notice refusing them access to Australian ports. Of these 16 vessels, 13 were banned for serious breaches of the MLC primarily relating to underpayment of wages, decent working and living conditions and inadequate provisions.
An estimated amount of AUD $313, 612 in wages was recovered from vessels in 2022. In 2022, two vessels were banned from Australian ports due to MLC breaches. The reasons for the bans included underpayment of wages and inadequate provisions. The vessels were banned for a period of three to six months.
Breakdown of complaints by vessel type
In 2022, 62.5 per cent of complaints received were from seafarers engaged on bulk carriers. This is a 6.1 per cent reduction from the 2021 complaints. One of the factors that likely influenced the reduction is the decrease in bulk carrier arrivals in Australia (2.48 per cent less in comparison to 2021).
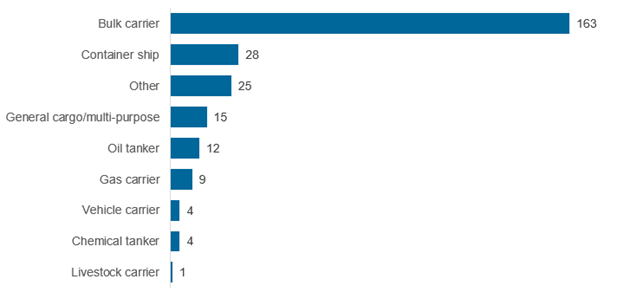
Table 2 – Breakdown of complaints by vessel type 2018-2022
Vessel type | 2018 | 2019 | 2020 | 2021 | 2022 |
Bulk carrier | 117 | 88 | 224 | 192 | 163 |
Chemical tanker | 5 | 2 | 9 | 14 | 4 |
Container ship | 18 | 11 | 43 | 20 | 28 |
Gas carrier | 0 | 6 | 12 | 13 | 9 |
General cargo/multi-purpose | 4 | 3 | 7 | 11 | 15 |
Livestock carrier | 9 | 4 | 4 | 4 | 1 |
Oil tanker | 11 | 7 | 8 | 6 | 12 |
Vehicle carrier | 3 | 4 | 3 | 3 | 4 |
Other | 11 | 28 | 10 | 17 | 25 |
Breakdown of complaints by State
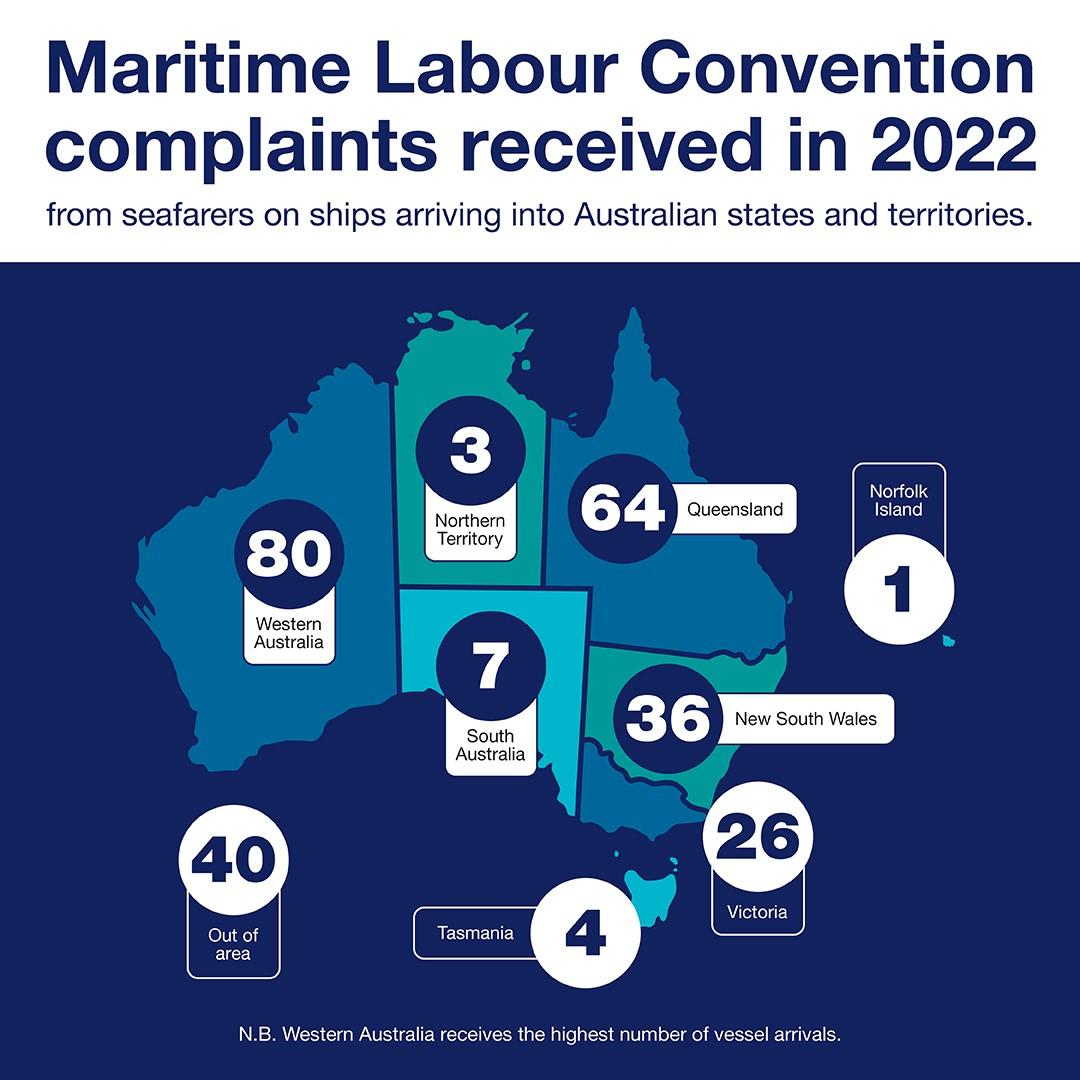
Figure 4 shows complains received broken down by the Australian state or territory in which the vessel arrived in 2022. Western Australia (28.6 per cent) and Queensland (22.9 per cent) represented the highest number of complaints. To note is that Western Australia (46.9 percent) and Queensland (26.2 percent) continue to represent the majority of bulk carrier vessel arrivals in Australia in 2022.
Complaints received by MLC titles
The main body of the MLC (the regulations and the code) is grouped into five main titles
with data coded accordingly.
Title 1 – Minimum requirements for seafarers to work on vessels
Title 2 – Conditions of employment
Title 3 – Accommodation, recreational facilities, food and catering
Title 4 – Health Protection, medical care, welfare, and social security protection (including bullying and harassment)
Title 5 – Compliance and enforcement
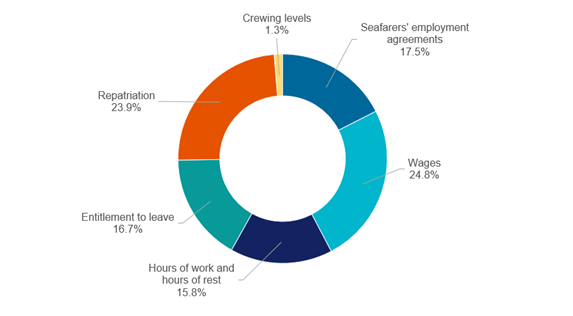
Title 2 of the MLC - Conditions of employment continues to make up the majority (56.9 per cent) of MLC complaints received. This includes seafarer employment agreements (SEAs), wages, hours of work and rest, entitlement to leave, repatriation, and crewing levels. This is followed by title 4 - Health Protection, medical care, welfare, and social security protection (including bullying and harassment) in which an increasing trend in complaints over the years is evident from the data.
Table 3 – MLC complaints breakdown by title 2018-2022
MLC title | 2018 | 2019 | 2020 | 2021 | 2022 |
Title 1 Minimum requirements | 1 | 3 | 1 | 1 | 2 |
Title 2 Conditions of employment | 157 | 108 | 480 | 295 | 234 |
Title 3 Accommodation, recreational facilities, food and catering | 48 | 38 | 47 | 51 | 68 |
Title 4 Health protection, medical care, welfare, social security protection | 61 | 55 | 73 | 85 | 100 |
Title 5 Compliance and enforcement | 7 | 1 | 1 | 0 | 7 |
Although not as significant as during Covid, the overall number of complaints, and the number of issues reported in the complaints remains significantly higher than the numbers reported pre-Covid in 2019. Complaints related to Title 4 increased from 85 (19.67 per cent of total complaints) in 2021 to 100 (24.3 per cent of total complaints) in 2022. The number of complaints continue to be a concerning issue and AMSA will continue to monitor these trends and ensure compliance with MLC is upheld by vessels coming into Australian waters.
Conditions of employment (Title 2)
Table 4 – Title 2 complaints for 2018-2022
MLC Regulation (Title 2) | 2018 | 2019 | 2020 | 2021 | 2022 |
2.1 Seafarers’ employment agreements | 19 | 17 | 195 | 83 | 41 |
2.2 Wages | 67 | 65 | 53 | 71 | 58 |
2.3 Hours of work and hours of rest | 36 | 29 | 29 | 32 | 37 |
2.4 Entitlement to leave | 6 | 3 | 1 | 0 | 39 |
2.5 Repatriation | 27 | 7 | 198 | 104 | 56 |
2.7 Crewing levels | 0 | 3 | 6 | 2 | 3 |
The proportion of Title 2 complaints in relation to all other complaints decreased slightly from 60.1 per cent in 2021 to 56.9 per cent in 2022, although the numbers of complaints under each Title are still high when compared to pre-Covid levels.
Title 2 complaints received regarding seafarer employment agreements decreased by 50.6 per cent from 83 in 2021 to 41 in 2022. Similarly, repatriation-related Title 2 complaints decreased by 46.2 per cent from 104 in 2021 to 56 in 2022 (Figure 5). This is an indication that AMSA’s response to repatriation complaints is working, and industry and operators are better equipped to manage the repatriation of seafarers.
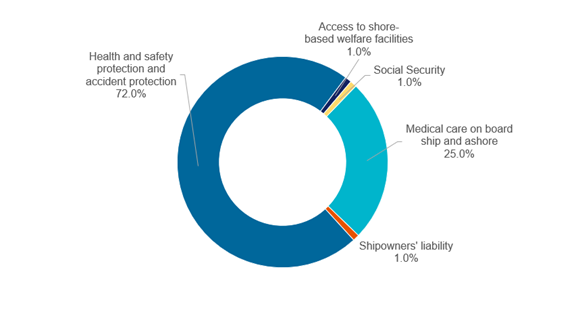
Health protection, medical care, welfare, social security protection (Title 4)
Table 5 – Title 4 complaints for 2018-2022
MLC regulation | 2018 | 2019 | 2020 | 2021 | 2022 |
4.1 Medical care on board ship and ashore | 13 | 5 | 29 | 29 | 25 |
4.2 Shipowners' liability | 0 | 0 | 0 | 1 | 1 |
4.3 Health and safety protection and accident protection | 23 | 36 | 42 | 54 | 72 |
4.4 Access to shore-based welfare facilities | 0 | 4 | 2 | 1 | 1 |
4.5 Social Security | 2 | 0 | 0 | 0 | 1 |
In 2022 a total of 72 complaints were received regarding concerns with health and safety protection and accident protection onboard. This represents an increase of 33.3 per cent on the number reported in 2021.
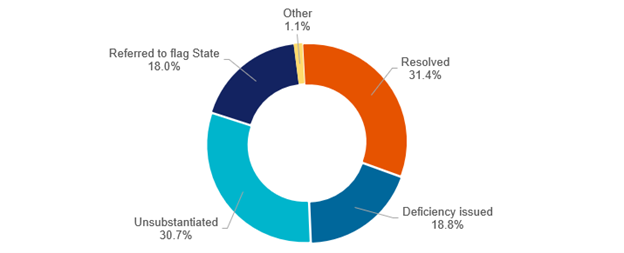
Breakdown of complaints by outcome
AMSA endeavours to follow-up all MLC complaints—and has done so—except in cases where the vessel was out of area and has not arrived in Australia and therefore beyond the regulatory oversight of AMSA. In those situations, AMSA refer the complaint to the flag State of the vessel and/or the next port State. AMSA may also place alerts on the vessel to ensure the complaint is followed-up when it next arrives in Australia. In all cases we try to ensure that the confidentiality of the complainant is maintained. Where AMSA refers information to the flag State or next port State, we expect that similar steps are taken to ensure the confidentiality of the complainant.
Figure 7 provides a breakdown of the follow up actions undertaken showing that 30.7 per cent of complaints received are unsubstantiated.
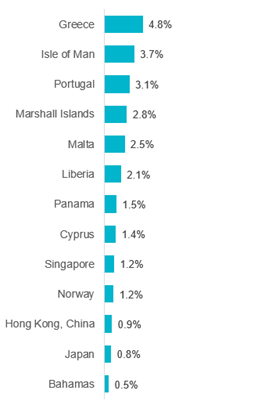
Breakdown of complaints received by flag State
Figure 8 shows the distribution of complaints received from foreign flagged vessels by flag State for 2022. Figure 9 shows the distribution of complaints when the number of port arrivals is taken into consideration6.
The flag States in Figure 8 and 9 accounted for 95.2 per cent of foreign flagged port arrivals in Australia and represented 92.0 per cent of complaints received from foreign flagged vessels in 2022.

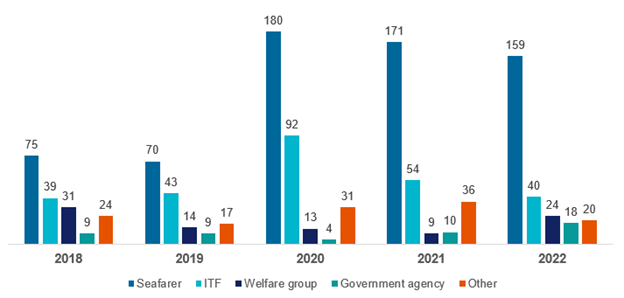
Source of complaints
The number of complaints originating directly from seafarers has increased across the years, from 75 in 2018 to 159 in 2022 representing an increase of 52.8 percent.
Table 6 – Source of complaints 2018-2022
Source | 2018 | 2019 | 2020 | 2021 | 2022 |
Seafarer | 75 | 70 | 180 | 171 | 159 |
ITF | 39 | 43 | 92 | 54 | 40 |
Welfare group | 31 | 14 | 13 | 9 | 24 |
Government agency | 9 | 9 | 4 | 10 | 18 |
Other | 24 | 17 | 31 | 36 | 20 |
This is likely an indication of the increased awareness of seafarers’ rights under the MLC and the reputation Australia has regarding seafarer welfare. Seafarers are therefore more confident that their concerns are taken seriously, actioned and treated confidentially when in Australia.
Footnotes
3 2022 data includes ten complaints received from nine regulated Australian vessels (RAV). The complaints received were under MLC Title 2: Conditions of employment and MLC Title 4: Health protection, medical care, welfare, social security protection and MLC Title 5: Compliance and enforcement. One complaint resulted in a deficiency being issued for Title 4.
4 Two separate vessels had two instances where a complaint was made and deficiencies were issued.
5 Seven vessels were detained during a follow-up inspection for deficiencies other than MLC.
6 Normalising the data by port arrivals provides for a better reflection of the complaint rate of vessels from different flag States.